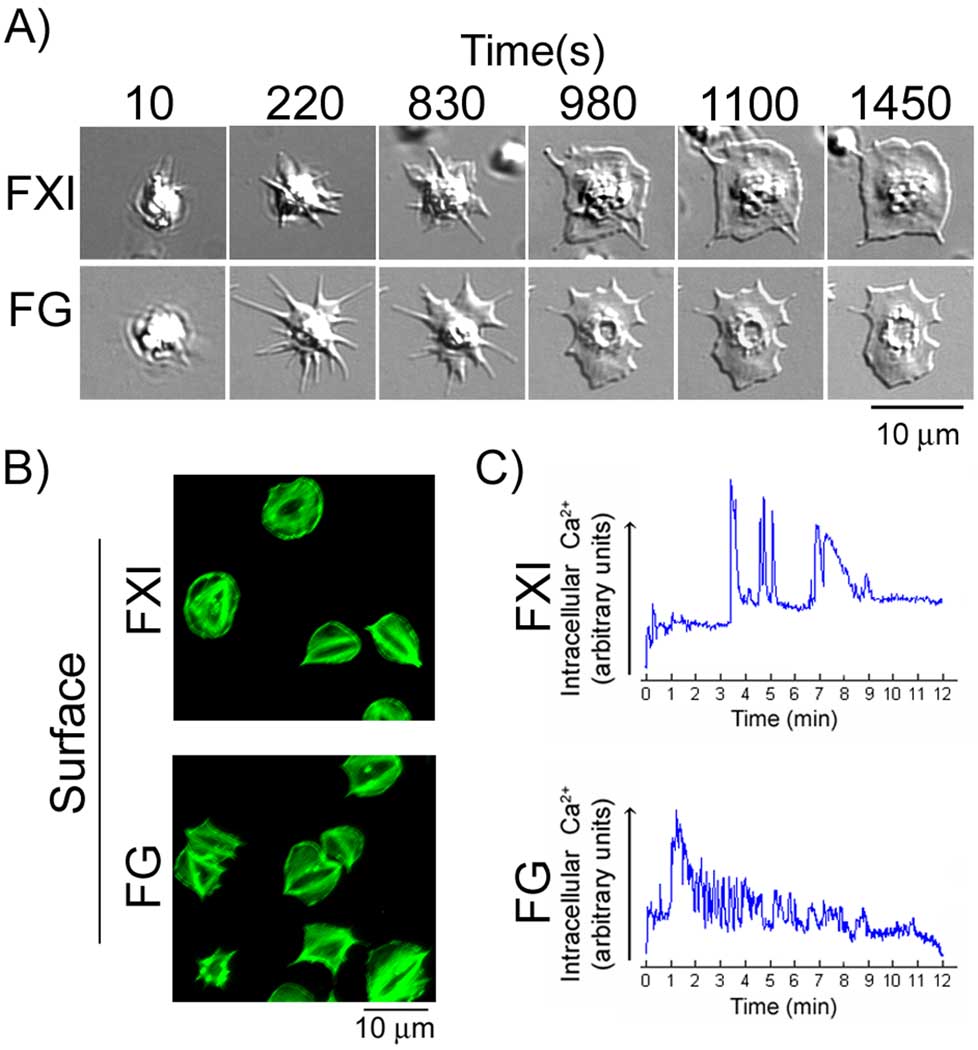
Figure 1. Platelet cytoskeletal reorganization on FXI surfaces.
(A) Purified human platelets (2 × 10⁷/ml) were exposed to surfaces coated with FXI or fibrinogen (FG) and observed in real time using differential interference contrast (DIC) microscopy. A representative time course of a single platelet spreading on each surface is shown. (B) Platelets adherent on each surface were fixed, permeabilized and stained for F-actin using FITC-conjugated phalloidin. (C) Purified human platelets loaded with the Ca2+-sensitive dye Oregon Green BAPTA 1-AM were imaged as they made contact with FXI- (top) or FG-(bottom) coated surfaces. The graphs show the basal Ca2+ level of individual platelets upon arrival to the region of interest and the subsequent Ca2+ fluctuations over a 12 min period of observation. The scale is in arbitrary units derived from the intensity of fluorescence emission.

