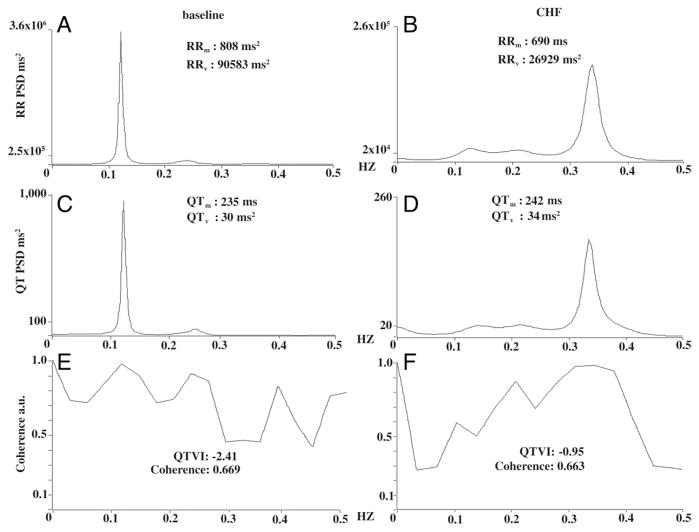
Figure 4. Power Spectral Analysis, Coherence, and QTVI.
RR and QT spectra obtained from the recordings of Figure 3. As in Figure 3, we reported the spectrum in the same dog at baseline (left panels) and during congestive heart failure (CHF) (right panels) under the same sympathetic activity levels. Panel A shows the power spectra for RR intervals at baseline, panel B during CHF. Note the dramatic reduction in RR-interval variance (RRv), less than two-thirds the value during CHF, and the reduced RR interval (RRm). Panels C and D show the spectra for QT intervals recorded at baseline and during CHF. Note that QT variance (QTv) and the mean QT interval (QTm) both increase. Last, panels E (baseline) and F (CHF) give coherence and corresponding QT variability index (QTVI) values calculated from the respective RR (baseline: A; CHF: B) and QT intervals (baseline: C; CHF: D) (QTVI = QTv/[QTm]2/RRv/[RRm]2). Note the increased QTVI during CHF. Note also that maximum coherence at baseline peaks at around 0.1 Hz and during in CHF at around 0.35 Hz. The maximum peak differs because the 2 synchronous spectral components RR (A) and QT (C) predominantly oscillate at a lower frequency at baseline than during CHF (0.1 and 0.35 Hz) (B and D). PSD = power spectral density in the area under the curve.

