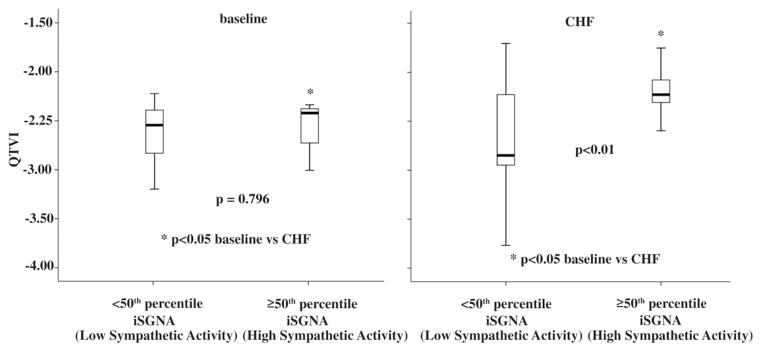
Figure 5. QTVI Changes in Baseline and in CHF.
In the subgroup recorded at high sympathetic activity values, the QTVI was significantly lower at baseline than during CHF. In the box plots, the central line represents the median distribution. Each box spans from 25th to 75th percentile points, and error bars extend from 10th to 90th percentile points. iSGNA = integrated stellate ganglion nerve activity; other abbreviations as in Figure 4.

