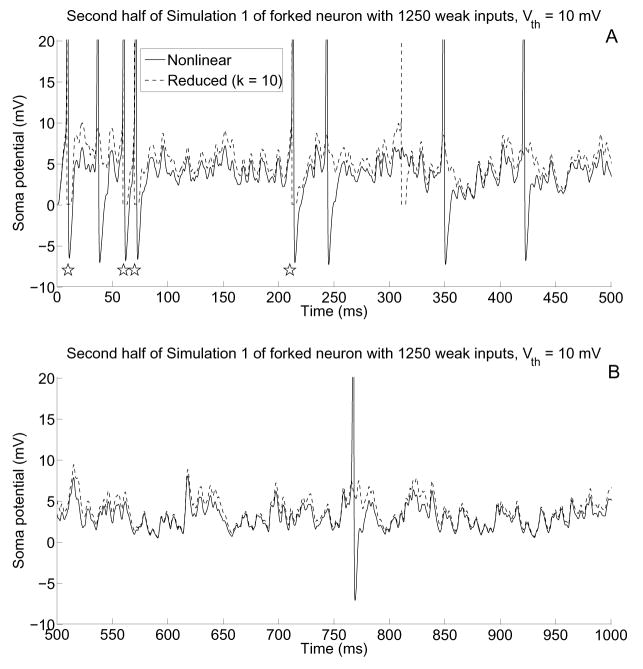
Fig. 11.
A–B) Soma potentials corresponding to the first and second halves of simulation 1 of the “weak” input case using Vth = 10 mV. Note that the reduced system spikes are drawn for clarification, and that the voltage axis has been scaled so that subthreshold behavior is more easily seen. Subthreshold behavior is of the nonlinear model is captured well by the reduced model, especially when less firing occurs, and stars below spikes in (A) indicate that four spikes have been captured by the reduced model

