
Fig. 2.
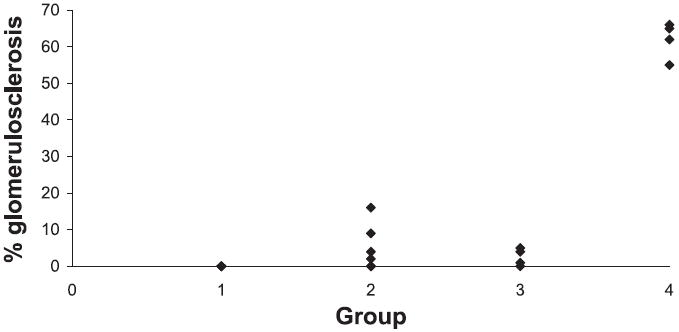
Percent glomerulosclerosis, focal and segmental, shown for WF sham (group 1), WF PAN (group 2), SD sham (group 3), and SD PAN (group 4). SD PAN show significance compared with all other groups (P < 0.01). Each symbol represents an individual rat.