
Fig. 3.
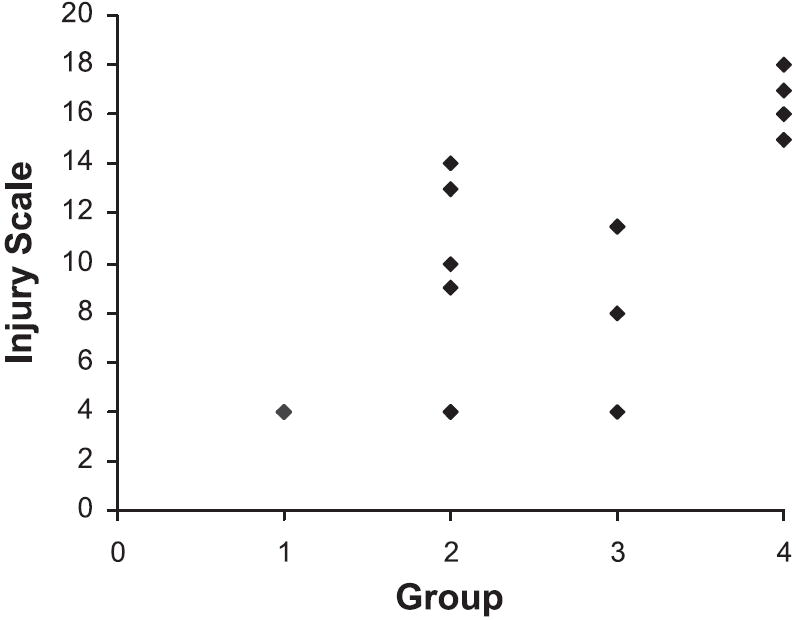
Ranks for overall injury shown for WF sham (group 1), WF PAN (group 2), SD sham (group 3), and SD PAN (group 4). SD PAN show significance vs. all groups (P < 0.05). Overall injury in the WF PAN was increased vs. WF sham (P < 0.01). Each symbol represents an individual rat.