
Fig. 4.
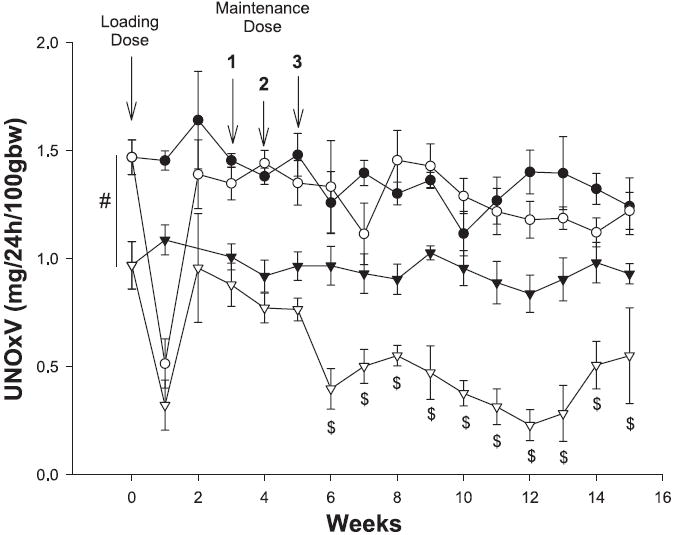
Twenty-four-hour excretion of NO2 + NO3 (UNOXV) of WF (circles) and SD (triangles) during the 15-wk PAN protocol. Open symbols are PAN and filled symbols are sham data. #P < 0.001 for WF vs. SD. $P < 0.05 for SD PAN vs. all other groups.
Official websites use .gov
A
.gov website belongs to an official
government organization in the United States.
Secure .gov websites use HTTPS
A lock (
) or https:// means you've safely
connected to the .gov website. Share sensitive
information only on official, secure websites.
Twenty-four-hour excretion of NO2 + NO3 (UNOXV) of WF (circles) and SD (triangles) during the 15-wk PAN protocol. Open symbols are PAN and filled symbols are sham data. #P < 0.001 for WF vs. SD. $P < 0.05 for SD PAN vs. all other groups.