
Fig. 6.
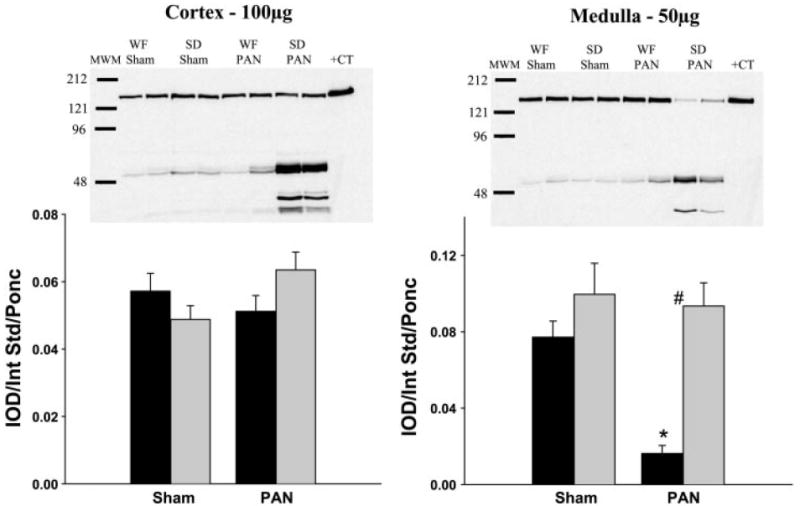
Relative abundance of renal endothelial NOS (eNOS) in the cortex and medulla of WF (gray bars) and SD (black bars) 15 wk following initial PAN administration or sham surgery. Representative gels are shown at the top (left: cortex; right: medulla) with average densitometric values (IOD/Int Std/Ponc) shown at the bottom. #P < 0.001 of WF vs. SD. *P < 0.001 of Sham vs. PAN.