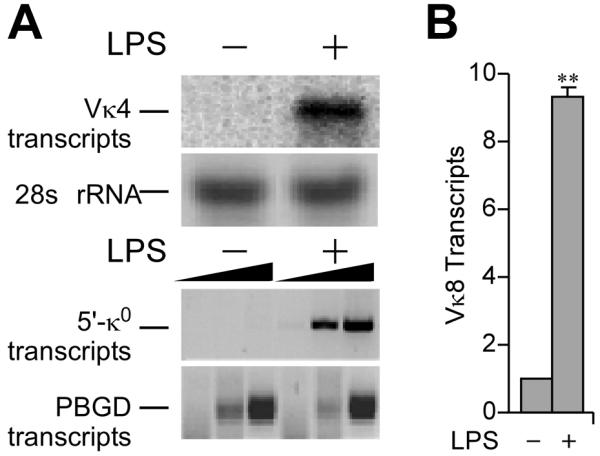
FIGURE 1.

LPS-induction of Igκ gene transcription. A, RNA samples from 70Z/3 cells before and after 20 h of LPS treatment as indicated. (Upper) Northern blot of rearranged Vκ4 gene transcripts with ethidium bromide staining of rRNA as a loading control. (Lower) RT-PCR analysis germline (κo) Igk gene transcripts with the housekeeping gene porphobilinogen deaminase (PBGD) transcripts used as internal controls, with a 3-fold serial dilution series of the templates. Representative results from several independent RNA preparations are indicated. B, Real time RT-PCR analysis of rearranged Igκ gene transcript levels in splenic B cells before and after 3 days of LPS treatment in culture. The value of 1.0 was assigned for the level of uninduced transcripts, and data were referenced to PBGD transcript levels. Standard deviations of at least five independent RNA preparations are indicated. Here and throughout, double and single asterisks indicate P<0.01 and P<0.05, respectively, resulting from statistical analysis of standard deviations from several independent experiments.
