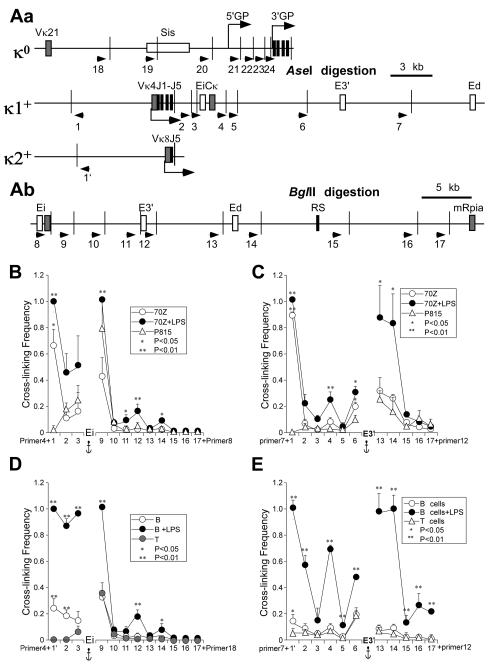
FIGURE 2.
3C analysis of germline and rearranged Igκ loci before and after induction of transcription. A, Maps of 3′ regions of mouse Igκ loci. Cell line 70Z/3 possesses one germline (κo) and one Vκ4 rearranged Igκ allele (κ1+) (55), while isolated splenic B cells from the animal model possess one rearranged Vκ8 gene (κ2+) (33). Exons and cis-acting sequences are indicated by closed and open rectangles, respectively. Arrows indicate the primers used in 3C assays. Narrow vertical lines depict restriction enzyme cut sites. Bent arrows indicate sites of initiation and the direction of transcription. Aa, Igκ loci were digested with AseI restriction enzyme. κo depicts the germline Igκ alleles in both 70Z/3 and splenic B cells. κ1+ indicates the rearranged Igκ allele in 70Z/3 cells and κ2+ denotes the rearranged Igκ allele in splenic B cells purified from targeted heterozygous mice. Ab, Igκ loci were digested with BglII restriction enzyme. The downstream region shown is common to germline and rearranged alleles. B, 3C assays in 70Z/3 cells before and after LPS treatment with Ei as the anchor fragment (primer 4 for AseI digests, or primer 8 for BglII digests). The amounts of 3C ligation products were measured by real time PCR using Taqman probes. Standard deviations of at least five independent chromatin preparations are indicated. Significant differences are in comparison to P815 mastocytoma cells. (Although the Vκ4 gene is far removed from the locus in the germline alleles of the negative control P815 cells, we can extrapolate the baseline cross-linking frequency expected for an adjacent fragment for purposes of statistical estimate, which predicts a significant interaction between Vκ4 and Ei or E3′ in 70Z/3 cells, either before or after induction of transcription. In addition, using a primer next to the BglII cutting site that is adjacent to the common J5 region in both germline and rearranged alleles paired with a E3′ primer, we obtain a significantly higher cross-linking frequency in 70Z/3 cells than in P815 cells (data not shown). C, 3C assays in 70Z/3 cells before and after LPS treatment with E3′ as the anchor fragment fragment (primer 7 for AseI digests, or primer 12 for BglII digests). Standard deviations of at least five independent chromatin preparations are indicated. Significant differences are in comparison to P815 mastocytoma cells. D, 3C assays in splenic B cells before and after LPS treatment with Ei as the anchor fragment (paired as in panel B). Standard deviations of at least two independent chromatin preparations are indicated. Significant differences are in comparison to T cells. E, 3C assays in splenic B cells before and after LPS treatment with E3′ as the anchor fragment (paired as in panel C). Standard deviations of at least three independent chromatin preparations are indicated. Significant differences are in comparison to T cells.

