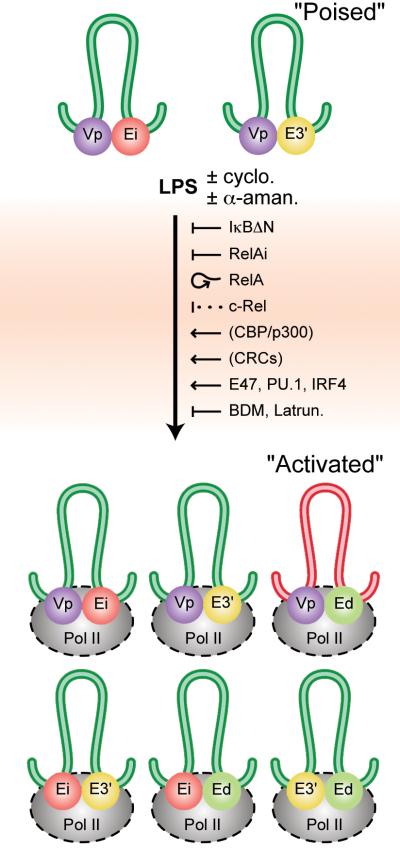
FIGURE 8.
Schematic summary of the results of this investigation. The diagram depicts interactions between the three Igκ gene enhancers, and the rearranged Vκ4 or Vκ8 gene promoters (Vp), in 70Z/3 and splenic cells, before and after LPS induction, with the looping out of the intervening DNA. Loops are color coded to represent structures common to 70Z/3 and splenic cells (green), those specific to 70Z/3 (blue), and those specific to splenic cells (red). The colored spheres represent protein complexes associated with the indicated cis-acting elements. Innocuous drugs, positive and negative regulators or inhibitors of the LPS activation process are also shown (cyclo., cycloheximide; α-aman., α-amanitin; Latrun., latrunculin A. A proposed negative role for c-Rel is shown with a dotted line and proposed positive roles for CBP/p300 and chromatin remodeling complexes (CRCs) are shown in parentheses. ChIP-3C experiments have demonstrated the presence of Pol II in all three pair-wise enhancer complexes in stimulated splenic cells (Fig. 6E) and also in complexes between the Vκ4 gene promoter region and Ei or E3′ in stimulated 70Z/3 cells (Fig. S7). The presence of Pol II in the other complexes shown in this Figure are generalizations depicted by dashes surrounding the enzyme complexes.

