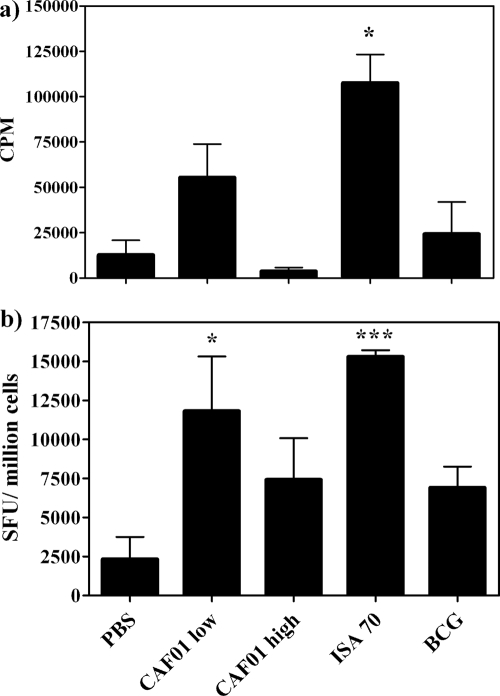
FIG. 3.
Assessment of T-cell proliferation (a) and assessment of central memory function by cultured ELISPOT assay (b) in PBMC 12 weeks following vaccination and boost with different adjuvant formulations. (a) Rv3019c-induced proliferation, expressed as counts per minute (CPM), as determined by [3H]thymidine incorporation. Bars represent means ± standard errors (SE). (b) IFN-γ production following cultured ELISPOT assay, expressed as spot-forming units (SFU) induced by stimulation with Rv3019c, normalized to SFC/106 cells. Bars represent means ± SE. *, P < 0.05; ***, P < 0.0005 (versus PBS controls; ANOVA).

