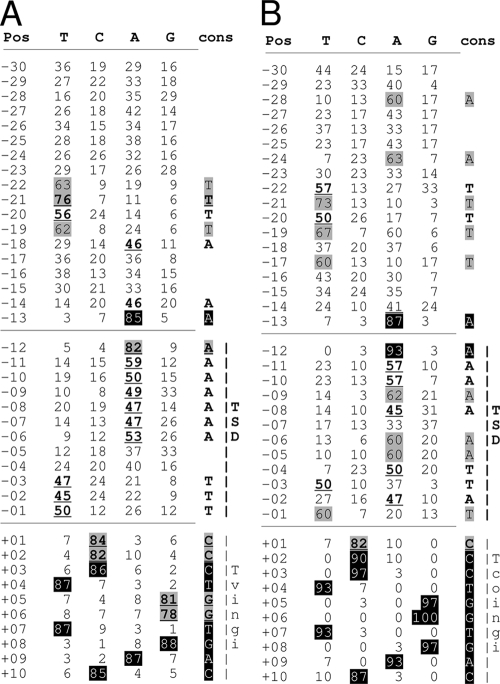
FIG. 7.
Base frequencies at different positions (Pos) upstream of the Tvingi (A) and Tcoingi (B) retroposons. The frequencies were analyzed in the 30 bp upstream of the retroposon sequence (positions −30 to −01), including the duplicated 12-bp residues (TSD), of 110 Tvingi and 30 Tcoingi sequences. When upstream sequences showed more than 95% identity, only one sequence was retained for this analysis. The values in columns T, C, A, and G represent the percentages of the T, C, A, and G residues, respectively, at individual positions. Values greater than 45% are indicated as follows: 45 to 59%, underlined and boldface; 60 to 74%, gray shaded; 75 to 84%, underlined, boldface, and gray shaded; and 85 to 100%, white numbers on a black background. The last column (cons) shows the conserved residues.

