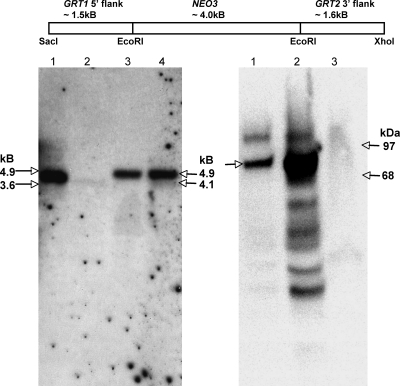
FIG. 4.
Macronuclear disruption of GRT1 and GRT2. At top is shown the organization of the construct used to disrupt GRT1 and GRT2 in the macronucleus. The NEO3 cassette confers resistance to paromomycin. Southern blot analysis (left panel) of wild-type cells and two independent ΔGRT1 ΔGRT2 cell lines (designated A and B) is shown. The probe used is shown in Fig. 3. The positions of the expected NcoI fragments for wild-type DNA (4.1 kb) and ΔGRT1 ΔGRT2 DNA (4.9 kb) are indicated on the right; the positions of electrophoresis standards (3.6 and 4.9 kb) are shown on the left. Lane 1, wild type; lane 2, 1/20th loading of wild-type cells to reveal the signal intensity expected for the two micronuclear copies; lane 3, ΔGRT1 ΔGRT2 line A; lane 4, ΔGRT1 ΔGRT2 line B. Western blot analysis of SDS lysates of wild-type and ΔGRT1 ΔGRT2 cells using a polyclonal antibody against Grt1p is shown at right. The position of Grt1p (80 kDa) is shown on the left; the positions of molecular mass standards (68 and 97 kDa) are shown on the right. Lane 1, wild-type lysate; lane 2, wild-type lysate, with 20× loading relative to lane 1; lane 3, ΔGRT1 ΔGRT2 (line A) lysate at a loading equivalent to that of lane 2.

