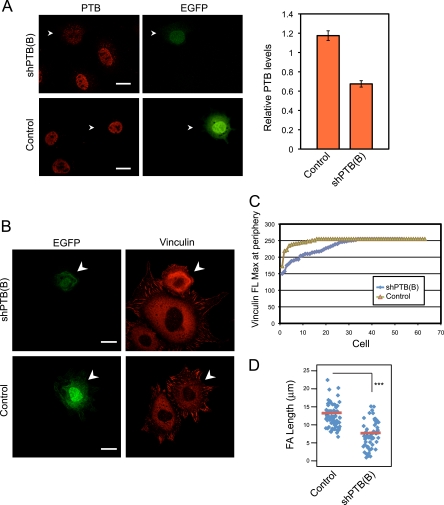
FIG. 4.
PTB knockdown decreases vinculin levels at the cell periphery and decreases the size of vinculin-containing focal adhesions. (A) MEFs were transfected either with empty vector (control) or with vector expressing a short hairpin targeting PTB [shPTB(B)]. After 3 days, cells were fixed and stained with anti-PTB antibody. The arrowhead indicates a green fluorescent protein-positive transfected cell. Scale bars, 20 μm. The mean fluorescence for PTB in the nucleus was measured for transfected and nontransfected cells from the same optical fields. The mean ratio of PTB fluorescence in transfected cells relative to that in nontransfected cells is plotted in the graph ± standard errors of the means [control, n = 72; shPTB(B), n = 65]. (B) MEFs transfected as for panel A were lifted and allowed to readhere to fibronectin for 90 min. The cells were fixed and stained for vinculin. Arrowheads indicate GFP-positive transfected cells. The shPTB(B)-transfected cells display less vinculin staining at the periphery and smaller focal adhesions. Scale bars, 20 μm. (C) The vinculin staining at the cell periphery of control and PTB knockdown cells was quantified using Zeiss image analysis software, and the maximum vinculin fluorescence (FL Max) at the periphery for each cell was plotted. Each data point represents a single cell examined. (D) Length of the longest focal adhesion (FA) for each cell was measured and the results displayed as a scatter plot. The red bar shows the mean, and asterisks indicate statistical significance measured by a paired t test (***, P < 0.0001). The numbers of cells measured are as follows: control, n = 63; shPTB(B), n = 52.

