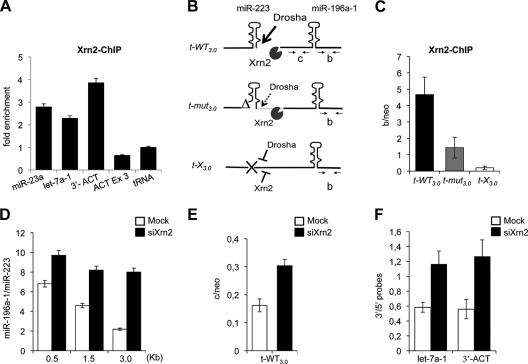
FIG. 4.
Xrn2 is associated with miRNA chromatin. (A) Xrn2 ChIP on endogenous miR-23a-1 and let-7a-1 loci. The downstream region of the β-actin gene poly(A) site (3′-ACT) was used as the positive control. β-actin (ACT Ex3) and tRNA coding regions act as negative controls. The histogram shows enrichments over the tRNA. (B) Schematic representation of Drosha and Xrn2 action together with the oligonucleotides utilized. The drawing corresponds to nascent pri-miRNAs transcribed from the different tandem constructs. (C) Xrn2 ChIP on chromatin from t-WT3.0-, t-mut3.0-, and t-X3.0-transfected cells. The histogram shows the ratio between Xrn2 immunoprecipitation values in “b” regions (B) and the neomycin gene (“neo”) carried by each plasmid. (D) The histogram shows miR-196a-1 accumulation from mock- or Xrn2-depleted cells (white and black bars, respectively), transfected with three different tandem constructs. The relative ratios between miR-196a-1 and miR-223 obtained from Northern blot signal quantification (y axis) for the different t-WT constructs utilized (x axis) are indicated. Gels are provided in Fig. S2B in the supplemental material. (E) RNA analysis of 3′-cutoff transcripts from the t-WT3.0 construct expressed in mock- and Xrn2-depleted cells. qRT-PCR for the “c” region (B) and neomycin gene was performed with the C-F and C-R and neo-F and neo-R oligonucleotide pairs. (F) let-7a-1∼let-7f and β-actin transcript analysis in mock- and Xrn2-depleted cells. The histogram shows the levels of the 3′-cutoff products identified by qRT-PCR normalized against specific 5′ regions (3′/5′ probes). Positions of the oligonucleotide pairs are shown in Fig. S2C in the supplemental material. Error bars show standard errors of the mean based on three independent experiments.

