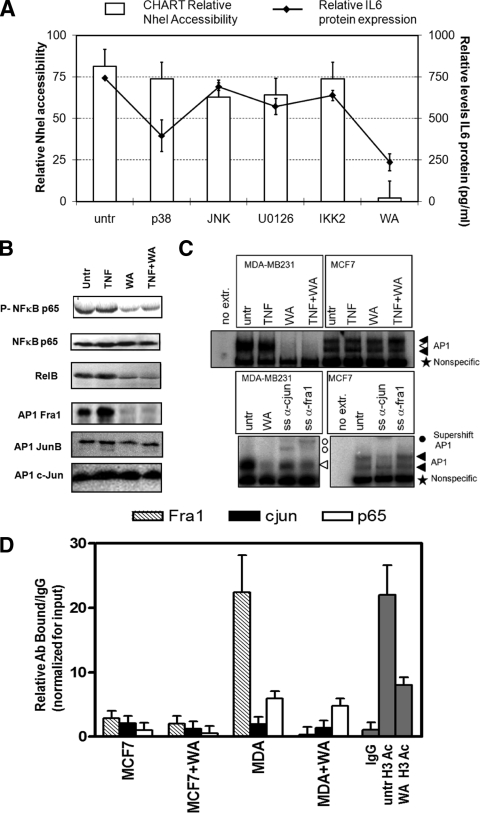
FIG. 11.
Combined inhibition of NF-κB or AP1 transcription factors by Withaferin A strongly silences chromatin accessibility and gene expression across the IL-6 gene promoter. (A) MDA-MB231 cells were treated for 3 h with IKK2 inhibitor IV (1 μM), p38 inhibitor SB205380 (10 μM), ERK inhibitor U0126 (10 μM), JNK inhibitor SP600125 (10 μM), or Withaferin A (WA; 2.8 μg/ml) as indicated. Corresponding IL-6 promoter chromatin accessibility by the NheI restriction enzyme was measured by CHART PCR in MCF7 cells or in MDA-MB231 cells, left alone (untreated [untr]) or treated for 3 h with the specific inhibitors indicated. Cell supernatants were collected for quantification of secreted IL-6 protein levels by IL-6-ELISA. Relative IL-6 protein expression levels are indicated as line graph in panel A (right axis). (B) Total cell extracts were prepared from MDA-MB231 cells treated for 3 h with Withaferin A (WA; 2.8 μg/ml) alone or cotreated for the last hour with TNF. Western analysis was performed for NF-κB p65, phospho-Ser536-p65, RelB, Fra-1, JunB, and c-Jun. (C) MCF7 and MDA-MB231 cells were treated for 2 h with TNF alone or TNF following 2 h of pretreatment with Withaferin A (2.8 μg/ml). Nuclear lysates were prepared, and AP-1 electrophoretic mobility shift assays were performed essentially as described previously (76). For supershift (SS) analysis, anti-c-Jun and anti-Fra-1 antibodies were added to the extracts 15 min before addition of the probe. (D) ChIP was performed against Fra-1, c-Jun, and NF-κB p65, acetylated histone H3 (antibody pool for acetyl K9 and acetyl K14) in MDA-MB231 cells, left alone or treated for 3 h with Withaferin A (2.8 μg/ml). Immunoprecipitate-bound IL-6 promoter DNA was quantified by qPCR, and ChIP results are represented as relative amount of bound antibody-specific immunoprecipitated DNA/immunoglobulin G (IgG)-aspecific immunoprecipitated DNA, normalized for the relative amount of input material. ChIP results are presented as bar graphs and are means of two ChIP experiments.

