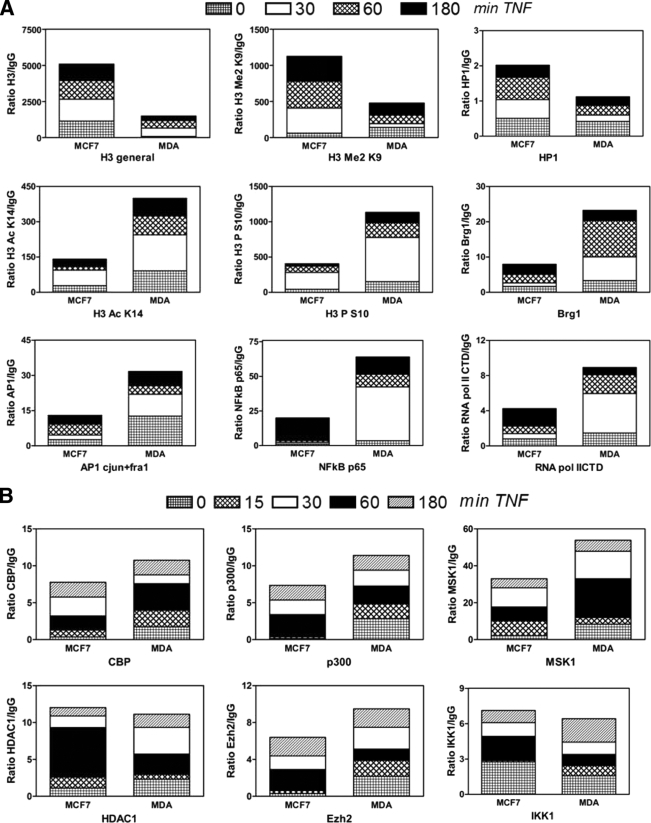
FIG. 3.
Weakly and highly invasive breast cancer cell lines demonstrate heterochromatic and euchromatic chromatin architectures at the IL-6 gene promoter, respectively. MCF7 and MDA-MB231 cells were left untreated or were treated with TNF (2,500 IU/ml) for various time points (as indicated on the figure). ChIP was performed against various histone modifications and transcription factors (A) or cofactors (B). Antibody-bound IL-6 promoter DNA was quantified by qPCR, and ChIP results are represented as relative amount of bound antibody-specific immunoprecipitated DNA to immunoglobulin G (IgG)-aspecific immunoprecipated DNA, normalized for relative amount of input material. ChIP results of the various time points are presented as stacked bar graphs and are means of two ChIP experiments. The standard error of the mean varies 15 to 30% between two experiments.

