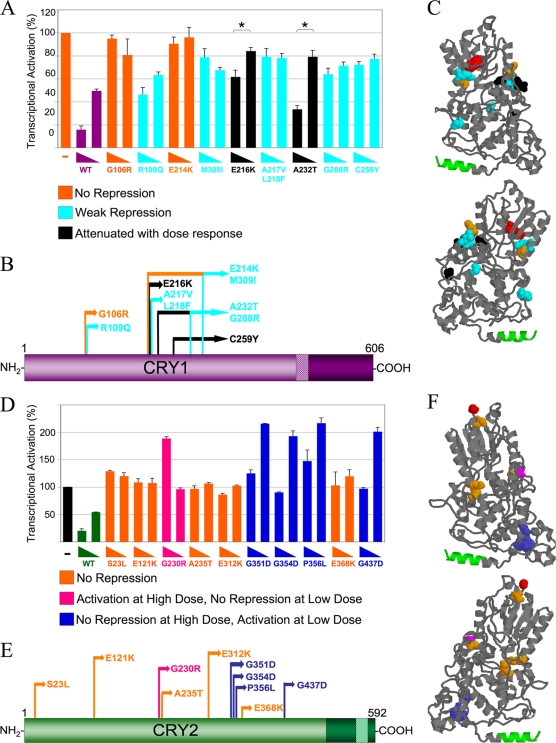
FIG. 2.
Some CRY mutants display loss of repression dose-response profiles, while some CRY2 mutants cause increases in CLOCK-BMAL1-mediated transcription. (A) CRY1 dose-response assay. HEK293 cells were transfected with Per2-luciferase reporter, Clock, Bmal1, and 25 or 5 ng of either mutant or wild-type (WT) Cry1-Renilla Luciferase. Each data point is averaged from results of three to six replicates, with the error bars representing the standard errors of the means (SEM). The mutants exhibited three general dose-response profiles: no repression, weak repression, and attenuated repression with a significant dose response (P < 0.01). (B) Schematic of CRY1 mutants' primary structure. The domains are indicated as described in the legend of Fig. 1. Each mutant's profile is color coded (see the key for panel A). (C) Homology model of the CRY1 PHR. This model was generated using the SWISS-MODEL protein homology-modeling server (10; http://swissmodel.expasy.org/workspace/) based on the structure of A. nidulans photolyase (Protein Data Bank code 1OWL) (11) and visualized using Protein Explorer (14). The N-terminal-most residue (red) and the coiled-coil domain (green) are shown. The mutations are color coded by repression profile (see the key in panel A). (D) CRY2 dose-response assay. This experiment was performed as described for panel A, except that 150 or 20 ng of either mutant or wild-type Cry2-GFP was used. The mutants exhibited three different dose-response profiles: no repression, no repression at the low dose with activation at a high dose, and no repression at the high dose with activation at a low dose. (E) Schematic of CRY2 protein with mutant profiles indicated. (F) CRY2 3D homology model with mutant repression profiles. This model was generated as described for panel C but using the CRY2 sequence. The mutant residues are color coded as described in panel D.

