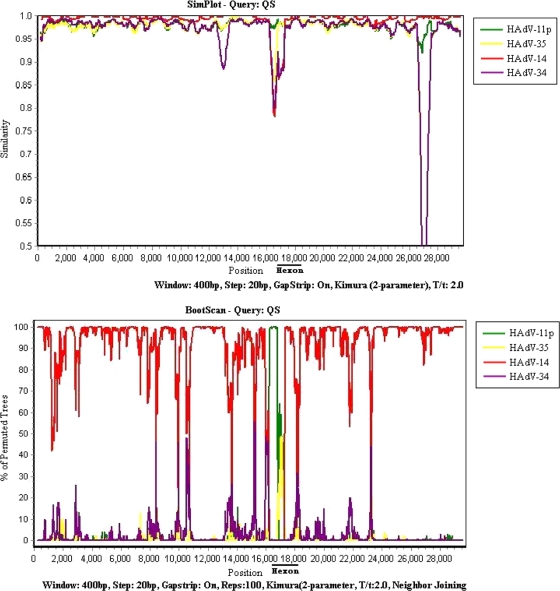
FIG. 2.
Similarities in the whole genome of HAdV strain QS compared to the sequences of the prototypical B:2 species strains of HAdV (HAdV-11p, HAdV-14, HAdV-34, and HAdV-35). The upper graph shows the results of similarity analysis, while the lower graph shows the results of bootscan analysis. The window is 400 bp, and the step is 20 bp. The Kimura model with the Jukes-Cantor correction was used. The vertical axis indicates the percentage of nucleotide similarity and the permuted trees between HAdV QS and the four strains representing the four serotypes of HAdV-B2. The horizontal axis indicates the nucleotide positions in the whole genome.

