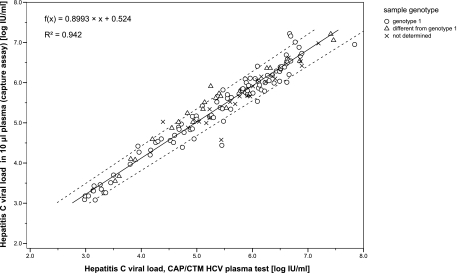
FIG. 1.
Correlation of HCV RNA quantitation results in 10-μl plasma samples and the CAP/CTM HCV plasma test. The viral loads are expressed in log10 IU/ml; the genotype is indicated if the information was available. The Passing-Bablok regression, 95% confidence intervals for slope and intercept, and coefficient of determination (R2) for all quantifiable results (n = 146) are indicated.

