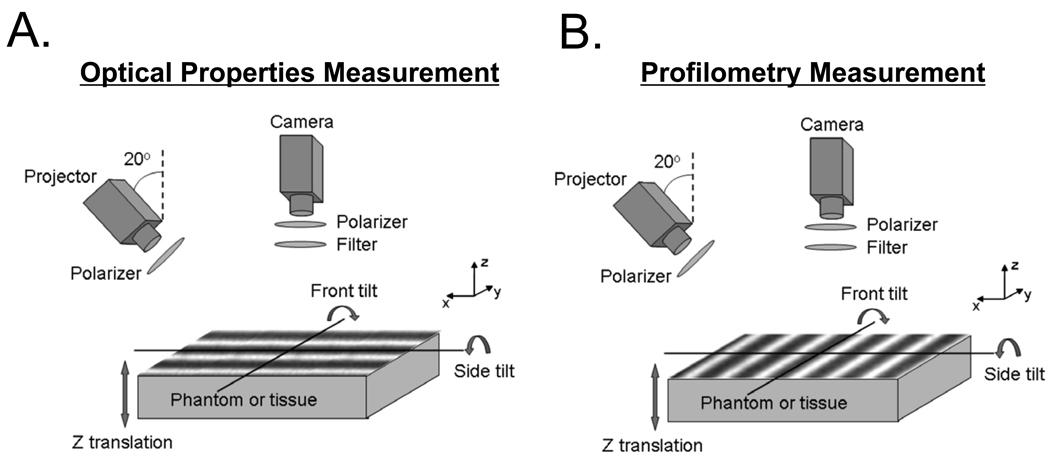
Figure 1. Instrumentation Schematics.
Intensity sine waves (grayscale stripes) are projected at a 20°angle onto a sample using a spatial light modulator, and collected with a 12-bit CCD camera. Collection is cross-polarized with respect to projection, and wavelengths are filtered using the tunable filter on the camera. Orientation of the sine waves is shown for optical properties measurement (A) and profilometry measurement (B).

