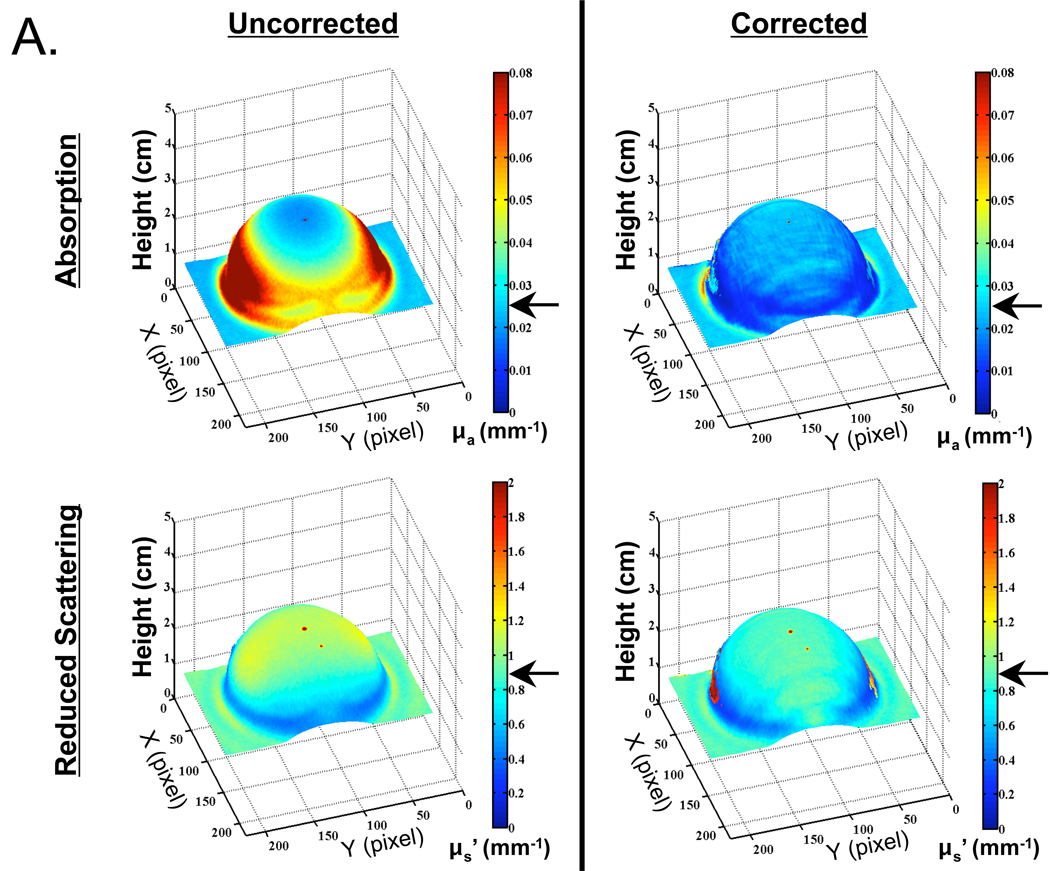
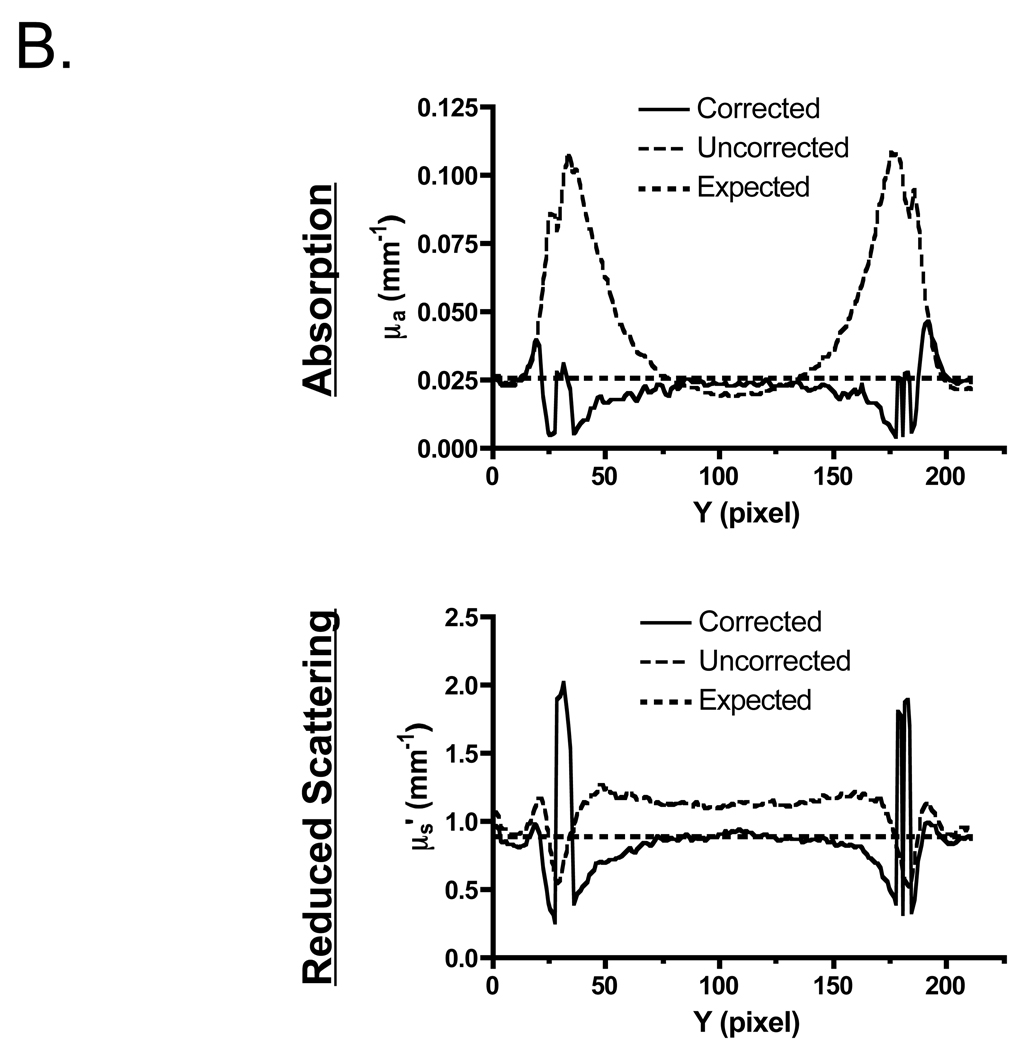
Figure 4. Optical Property Measurements of a Hemispheric, Tissue-Like Phantom having Homogeneous Optical Properties.
A. Recovered absorption coefficients (top) and reduced scattering coefficients (bottom) at 670 nm either without (left), or with (right), profilometry-based correction for height and angle. Arrows indicate the expected theoretical value.
B. Cross-sectional plots from (A), through the center of the hemisphere, of recovered absorption coefficients (top) and reduced scattering coefficients (bottom) at 670 nm. Profilometry-corrected data (solid curve) and uncorrected data (thin dashed curve) are shown along with the expected theoretical values (thick dashed curves).


