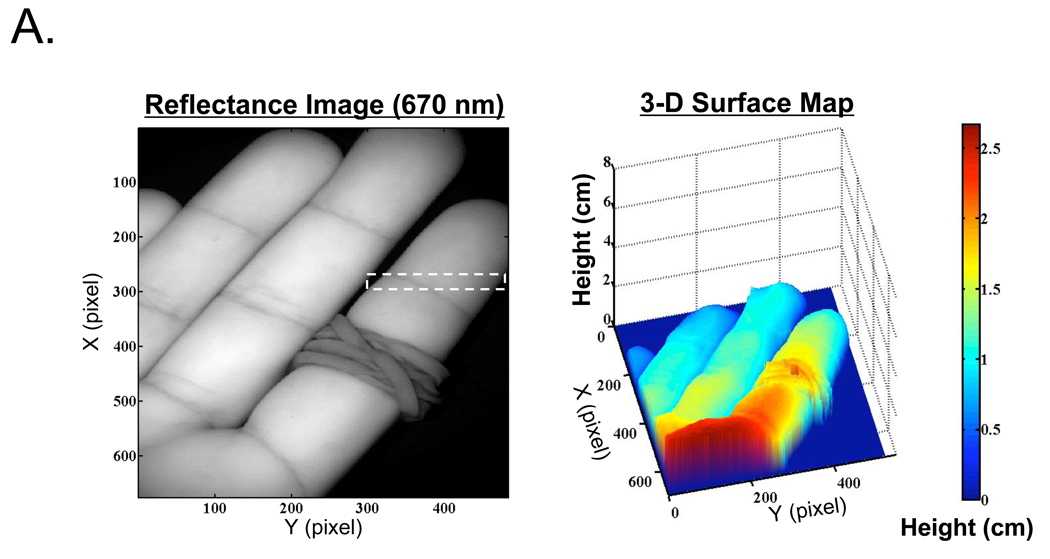
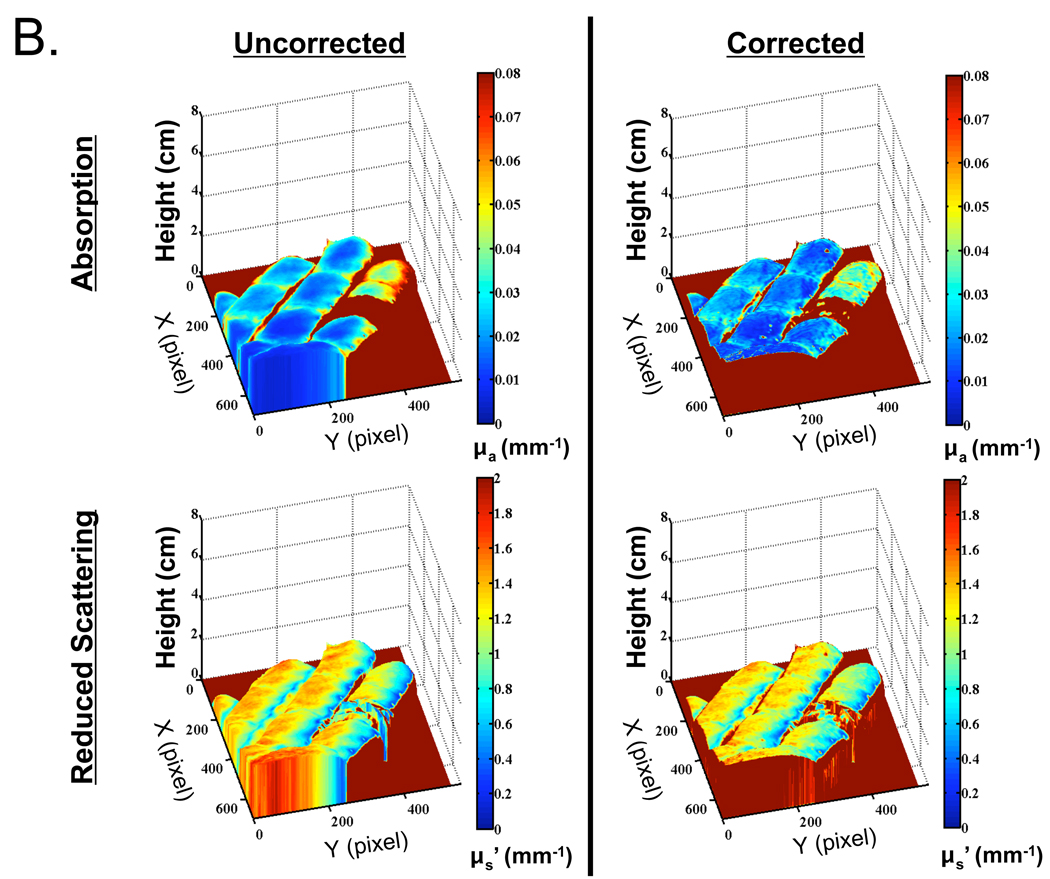
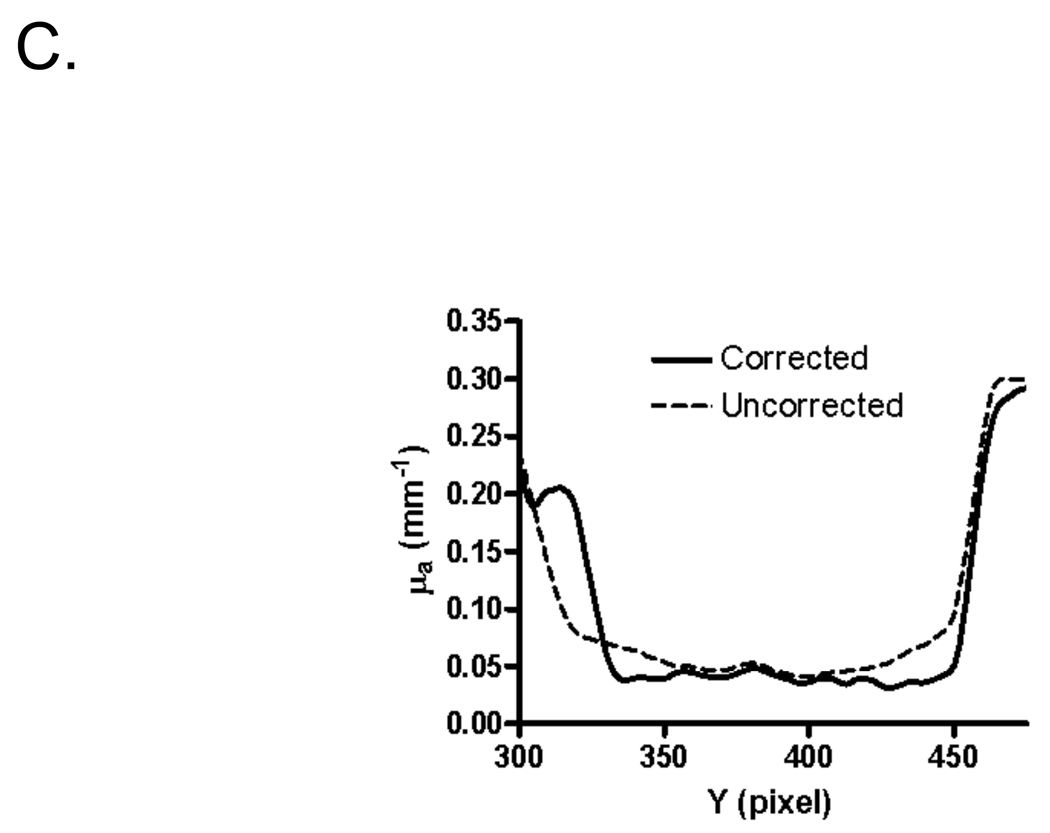
Figure 5. In Vivo Imaging of a Human Hand.
A. Reflectance image of a right hand having an index finger constriction (rubber band), taken at 670 nm (left), and the 3-D plot of the hand obtained using phase profilometry (right). Dashed box indicates the region-of-interest for cross-sectional quantitative analysis.
B. Recovered absorption coefficients (top) and reduced scattering coefficients (bottom) at 670 nm either without (left), or with (right), profilometry-based correction for height and angle. Note increased absorption at 670 nm on the constricted finger due to an increase in deoxyhemoglobin and total hemoglobin.
C. Cross-section along the Y-axis through the constricted finger (X = average of pixels 275 to 300; see dashed box in Figure 5A) of the hand shown in Figure 5B. Corrected (solid curve) and uncorrected (dashed curve) absorption coefficients are plotted.


