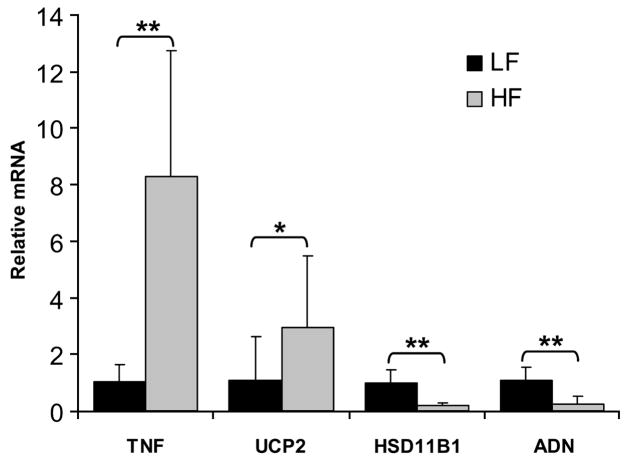
FIGURE 3.
Relative mRNA concentrations for tumor necrosis factor (TNF), uncoupling protein 2 (UCP2), hydroxysteroid 11-β dehydrogenase type 1 (HSD11B1), and adipsin (ADN) in mice fed a LF diet compared with mice fed a HF diet. Values were normalized to 18S ribosomal subunit expression. A 40-ng sample of total RNA per reaction was used to quantitate all templates except 18S RNA, where 160 pg per reaction was used. Values are means + SD, n = 5–10. Asterisks indicate that means differ: *P < 0.05, **P < 0.01.

