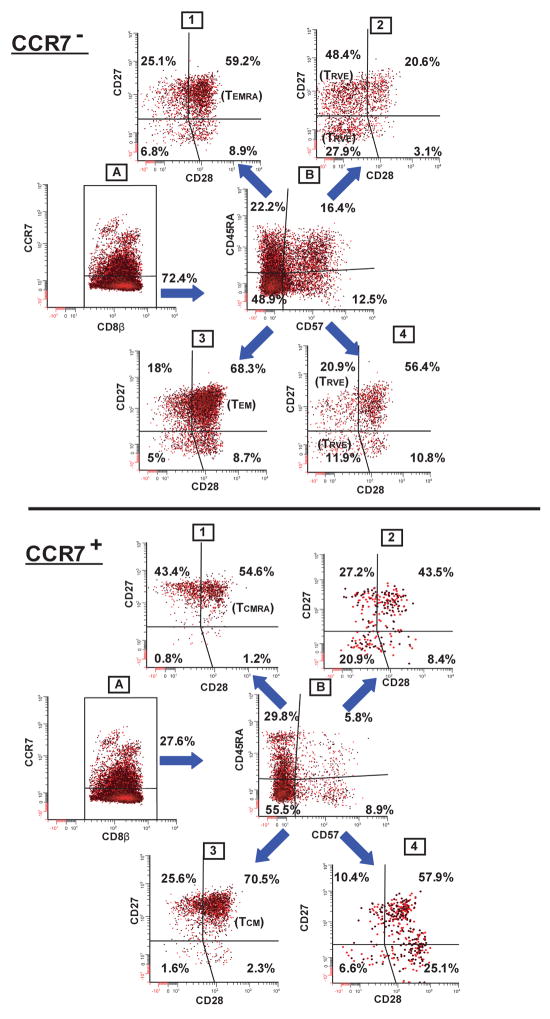
Figure 5.
Sequential 2 parameter dot-plot gating strategy used for 8-color flow cytometry analysis of gp100-specific CD8+ memory T cells from a representative patient. The staining panel consisted of reagents specific for: CD8β/gp100 tetramer/CCR7/CD45RA/CD57/CD27/CD28/CD14, CD19, 7AAD cocktail. Only viable, gp100209-217 tetramer+ CD8+ T cells were selected for analysis and further divided into CCR7− (upper panel-dot plot A), or CCR7+ (lower panel-dot plot A) subpopulations. By example, CCR7−/tetramer+/CD8β+ T cells were selected (CCR7− panel; dot plot A) and further analyzed for CD45RA vs. CD57 expression (CCR7− panel; dot plot B). Cells from each of the CD45RA vs. CD57 dot plot quadrants were then analyzed for CD27 vs. CD28 staining (CCR7− panel; dot plots 1–4). 16 different subphenotypes were delineated in the CCR7− compartment, and, by similar analysis, another 16 subpopulations in the CCR7+ compartment.

