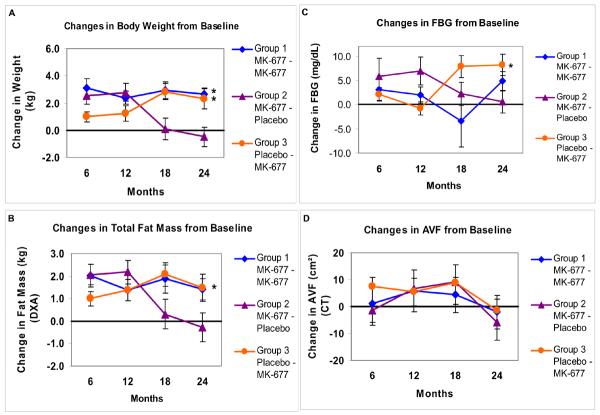
APPENDIX FIGURE 7. Changes from baseline in body weight, total body fat, FBG and AVF every 6 months for 2 years.
Data presented are arithmetic mean (SE) changes from baseline at 6, 12, 18 and 24 months; body weight (Panel A), total body fat mass by DXA (Panel B), FBG (Panel C) and AVF (Panel D). An asterisk indicates a significant difference in the change from baseline to 24 months within the group (Bonferroni-adjusted P values). In subjects treated with placebo followed by MK-677 in year 2 (Group 3), the change from baseline in body weight and FBG were significant (P=0.002 and P=0.001, respectively). In subjects treated with MK-677 for 2 years (Group 1), body weight was significantly increased (P=0.001), but fasting blood glucose was not (P=0.093). Total body fat mass by 4-C model was significantly increased (P=0.016) in Group 1, but body fat by DXA was not (P=0.062). There were no significant changes in AVF from baseline to 24 months in any group. FBG=fasting blood glucose), AVF=abdominal visceral fat from computed tomography (CT), DXA = dual energy x-ray absorptiometry

