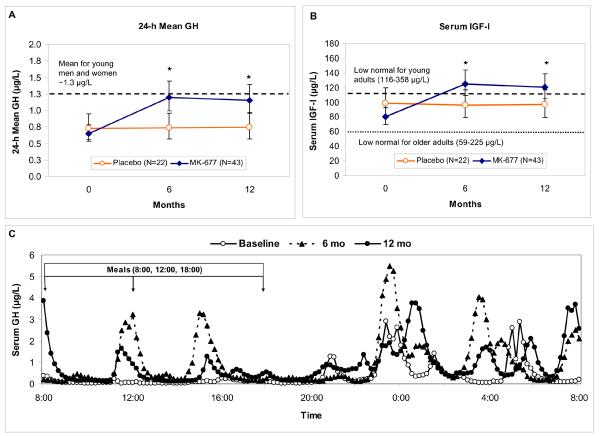
FIGURE 2. Serum 24-h mean GH and IGF-I results in pivotal year 1.
GH and IGF-I data were not normally distributed and were analyzed on the natural logarithmic scale; line graphs show geometric means and 95% confidence intervals. Results of GH deconvolution analysis are included in APPENDIX TABLE 1.
Panels A and B: 24-h mean GH and serum IGF-I levels at baseline, 6 and 12 months. An asterisk indicates P<0.001, MK-677 vs. placebo. In Panel A, the 24-h mean GH for young men and women combined (~1.3 μg/L) is indicated by a dashed line. In Panel B the lower limit of the IGF-I normal range is indicated: older adults (59-225 μg/L, lower dotted line); young adults aged 21-25 (116-358 μg/L, upper dashed line). GH=growth hormone, IGF-I=insulin-like growth factor-I.
Panel C: Representative 24-h GH profiles in one 70-year-old man, BMI, 23.2 kg/m2, treated for one year with MK-677. 24-h mean GH levels were 0.37, 1.0 and 0.86 μg/L at baseline (open circles), 6 months (triangles) and 12 months (closed circles), respectively. Note that the pulsatile pattern of GH secretion at baseline is maintained and enhanced at 6 and 12 months, primarily as a result of increased secretion per peak rather than peak frequency.

