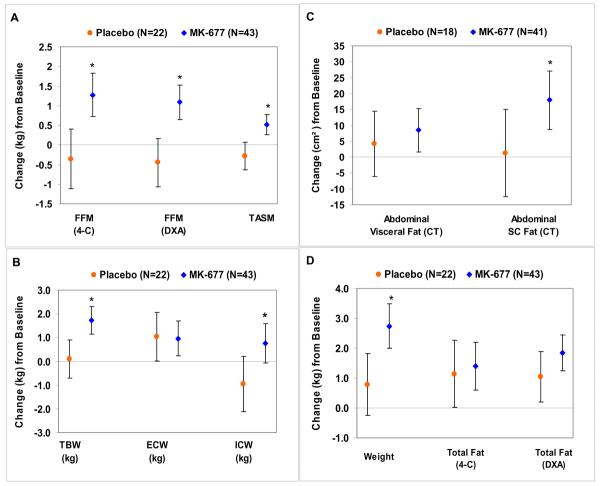
FIGURE 3. Changes in body composition at 12 months.
Graphs show arithmetic differences (95% CI). An asterisk indicates a significant difference (MK-677 vs. placebo) at 12 months. Panel A: Changes in fat-free mass (FFM, by 4-C model and by DXA) and TASM (total appendicular skeletal muscle mass by DXA). Panel B: Changes in TBW (total body water), ECW (extracellular water) and ICW (intracellular water). The increase in TBW and increase in ICW with active drug are consistent with the anabolic effects of MK-677. Panel C: Changes in abdominal visceral and abdominal subcutaneous fat cross-sectional areas measured by CT. Panel D: Changes in body weight and total fat mass (by 4-C model and DXA). CT = computed tomography; DXA = dual energy x-ray absorptiometry

