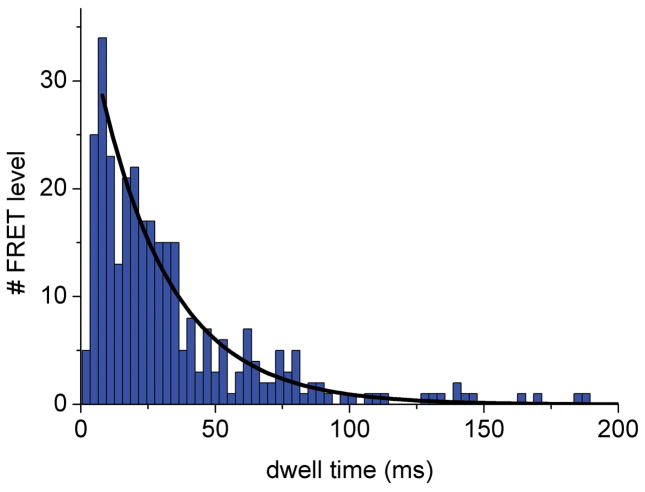
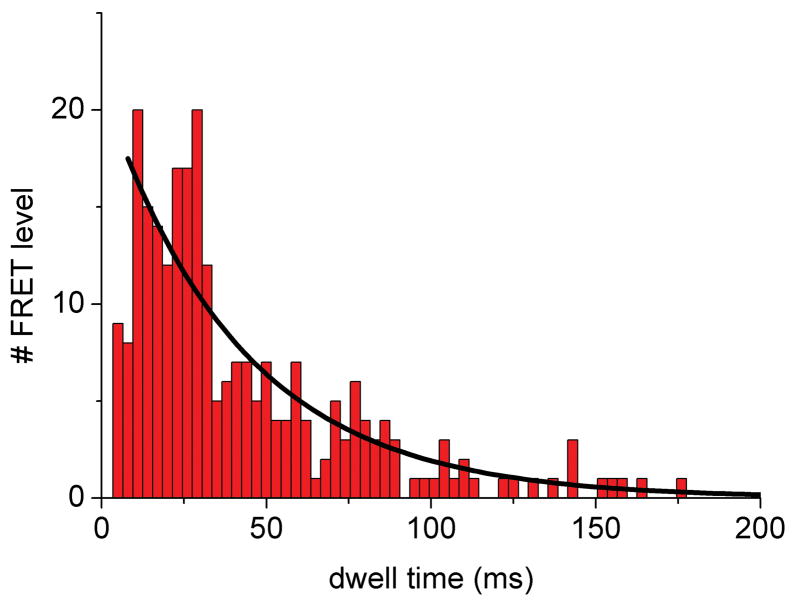
Figure 5.
Dwell time histograms of single FRET-labeled F1Fo-ATPase from E. coli in liposomes showing aurovertin inhibition of ATP hydrolysis. FRET levels were assigned manually and dwell times binned to 3 ms. (A) Dwell time histogram in the presence of 1 mM ATP; (B) dwell time histogram in the presence of 20 μM aurovertin and 1 mM ATP. Black lines are monoexponential decay fittings.


