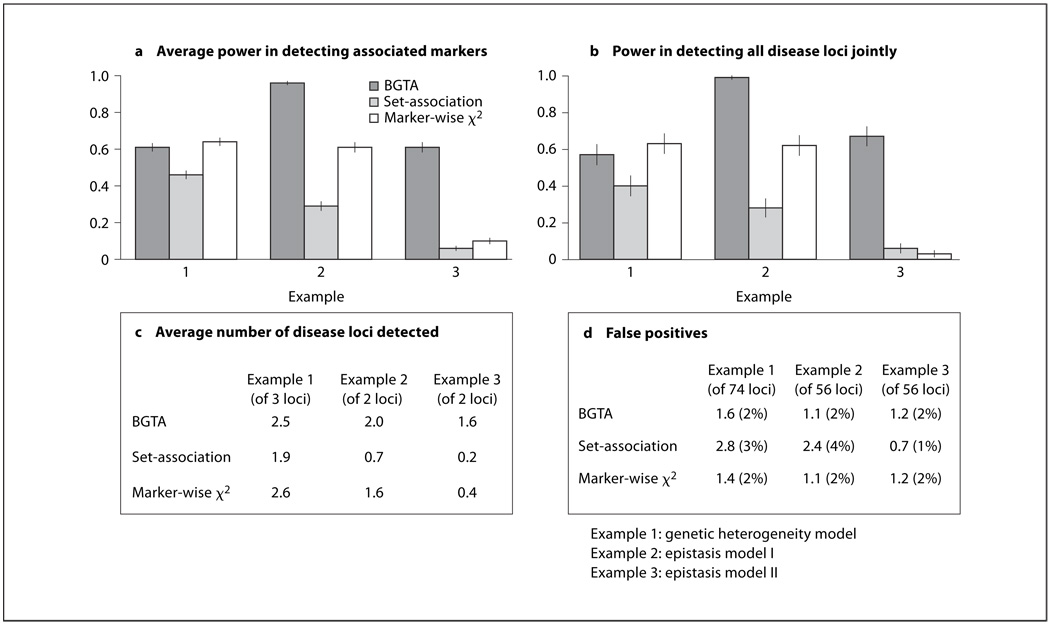
Fig. 1.
Comparison between BGTA, set-association and markerwise χ2 tests using simulations. BGTA, the set-association algorithm and marker-wise χ2 tests are compared using simulations under three disease models (examples 1–3). a Average power in detecting associated markers with 95% confidence bars, which is the average probability for an associated marker to be selected (averaged over 4 or 6 associated markers: 2 markers per disease gene loci are simulated). b Power in (or the probability of) detecting all disease loci jointly with 95% confidence bars. c Average number of disease loci detected. d Average number of unassociated markers selected with corresponding estimated probability of false positives. The performance is evaluated using 300 simulated data sets of 150 diseased (cases) and 150 undiseased (controls) individuals. For example 1, 80 markers are simulated and for examples 2 and 3, 60 markers are simulated. Simulation specifications: (1) for example 1, disease gene predisposing allele is set to have population frequency 0.05; for examples 2 and 3, disease gene predisposing allele is set to have population frequency 0.5. (2) Marker allele population frequencies are set to 0.5. (3) Linkage/ LD between disease loci and associated markers: θ = 0.01 (recombination fraction) and Δ = 0.8 (standard LD). (4) Inter-markers linkage/LD are randomly generated from θ ~ U (0.05, 0.1) and Δ ~ U (0.1, 0.2). (5) For all examples, individuals without the disease predisposing genotypes have a 0.001 probability to be affected. BGTA specifications: random subset size used is k = 10; B = 5,000 random subset screenings were run for each simulation; marker selection is through IQR-based criterion on return frequencies. Set-association specifications: maximum number of top markers to sum is set to 20; the final selection significance level is set to 0.05.

