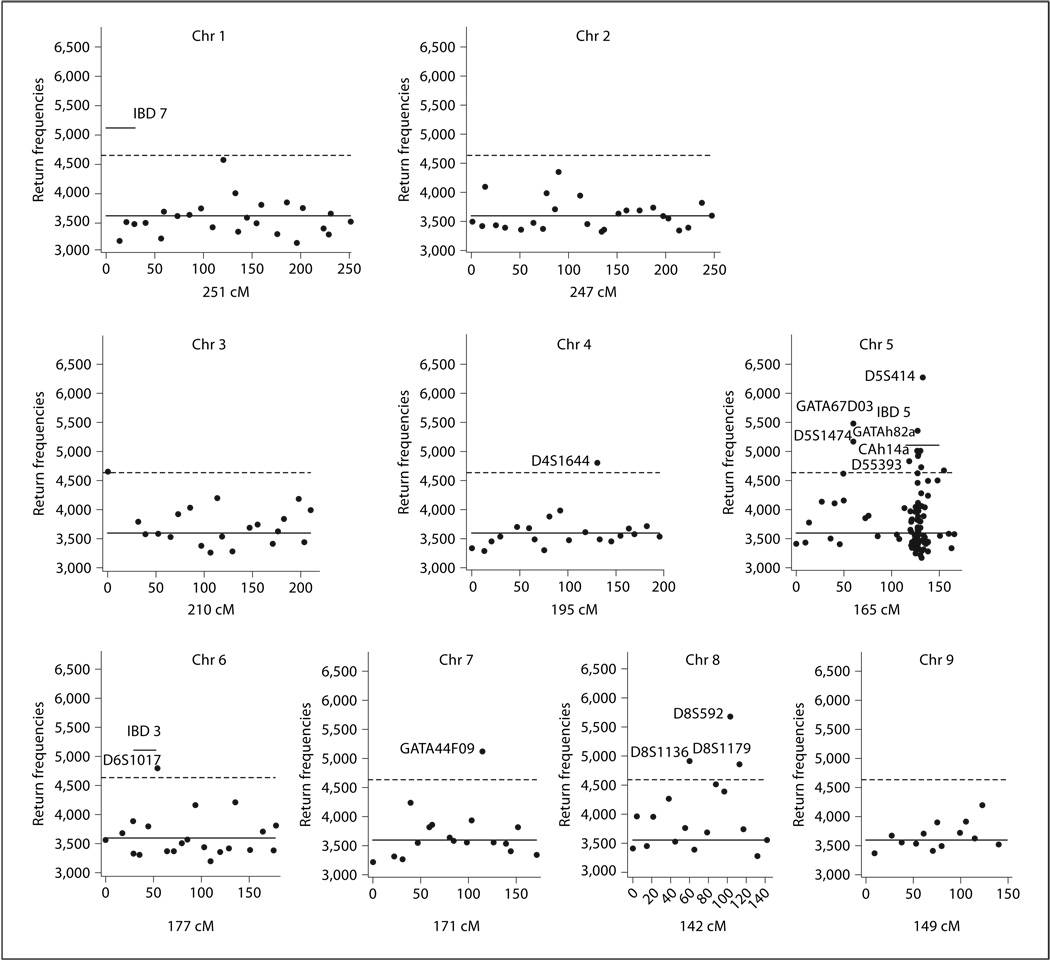
Fig. 2.
BGTA return frequencies for IBD data: chromosomes 1–9. Aggregated return frequencies from 500,000 BGTA random subset screenings (k = 8) are plotted versus marker location on the genome. Only markers included in the screening are shown. The median return is marker by a horizontal solid line, whereas the selection threshold is marked by a broken line. Selected important markers are labeled for readers’ reference. Seven horizontal bars indicate the previously reported IBD susceptibility loci, IBD1–IBD7. BGTA identified IBD2, IBD3 and IBD5 and showed weak signals on IBD1 and IBD4.

