Figure 1.
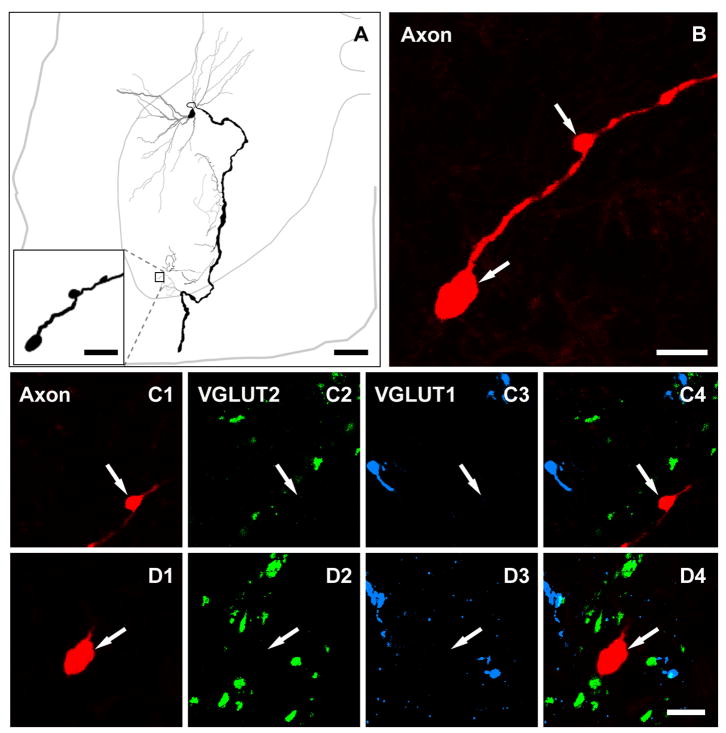
A reconstruction of a cat motoneuron and its axon collaterals that was intracellularly labelled with Neurobiotin (A) and a series of confocal microscope images illustrating the absence of VGLUT1 and 2 immunoreactivity within the motoneuron axon terminals (B–D). A, the soma and axonal arborisation are shown in black and dendrites in grey. The thinner grey line represents the outline of the grey matter and the central canal; the thicker grey line represents the border of the spinal cord. The axon terminals illustrated in figure B, C, and D are taken from the area outlined by the box in A. B shows a projected image through a series of terminals. C1-C4 are single optical sections and D1-D4 are projected images of two individual terminals (arrows). C4 and D4 are merged images confirming the absence of overlap of immunoreactivity for VGLUT1 and VGLUT2 and labelled motoneuron terminals. Scale bars: 200μm (large panel in A); 10 μm (small panel in A and B); 5 μm (C1-C4 and D1-D4).
Figure 1. A seires of confocal microscope images illustrating the absence of VGLUT1 and 2 immunoreactivity within motoneuron axon terminals in the cat. The large panel on the left shows a projected image through a series of terminals originating from a motoneuron that was intracellularly labelled with Neurobiotin. Small images show single optical sections (top row) and projected images (the bottom row) of two individual terminals (arrows). The right panel of each series is a merged image confirming the absence of overlap of immunoreactivity for VGLUT1 and VGLUT2 and labelled motoneuron terminals and. Scale bars: 10 μm (for the large panel); 5 μm (for the small images).

