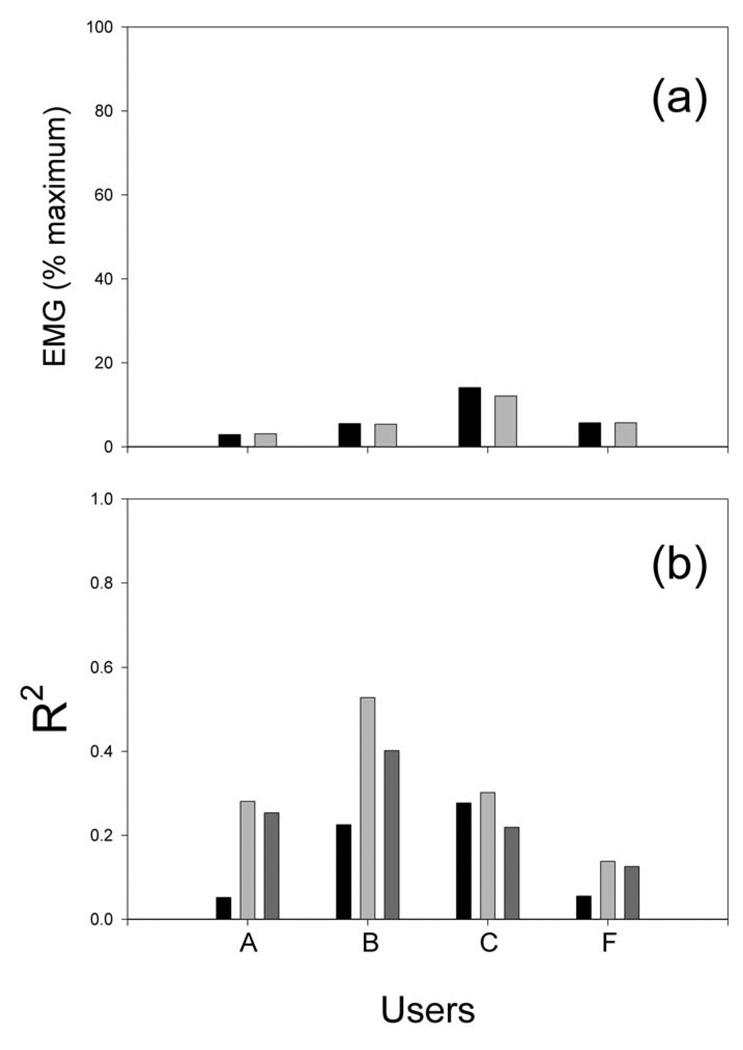
Figure 6.
Summary of EMG activity and its impact during the target selection phase in each of the four users tested. A: EMG (as % of maximum voluntary contraction) for the user’s most active muscle when the target reached was correct (black) or incorrect (gray). B: The corresponding R2 values for: a multiple regression with all EMG channels (black); a regression with the EEG control signal (light gray); and a regression with the EEG control signal corrected for the EMG channels (dark gray). For all users, the EEG control signal correlated with the appropriate selection outcome and that correlation was largely independent of EMG activity.

