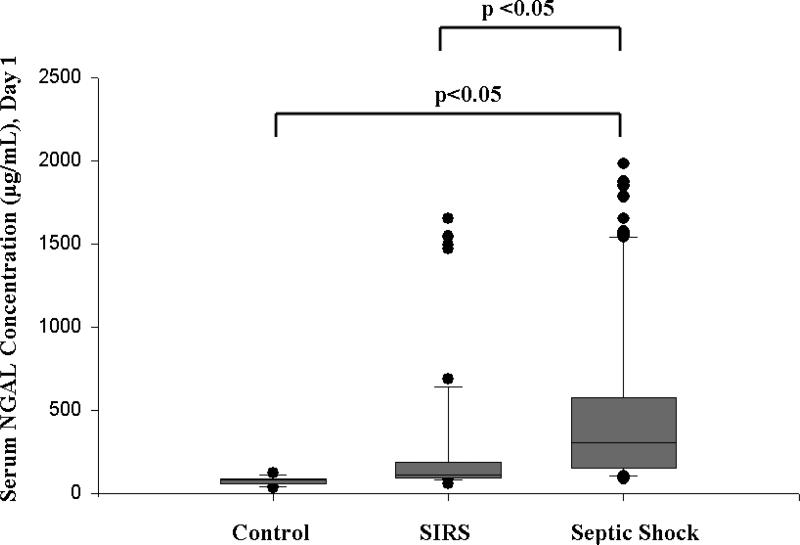
Figure 1. Box and whisker plot of serum NGAL concentrations measured on day 1 of admission to the PICU in 143 critically ill children versus 25 healthy children.
The vertical box represents the 25th percentile (bottom line), median (middle line), and 75th percentile (top line) values, while the error bars represent the 10th and 90th percentile values. The dots represent values outside the 10th and 90th percentile, respectively.

