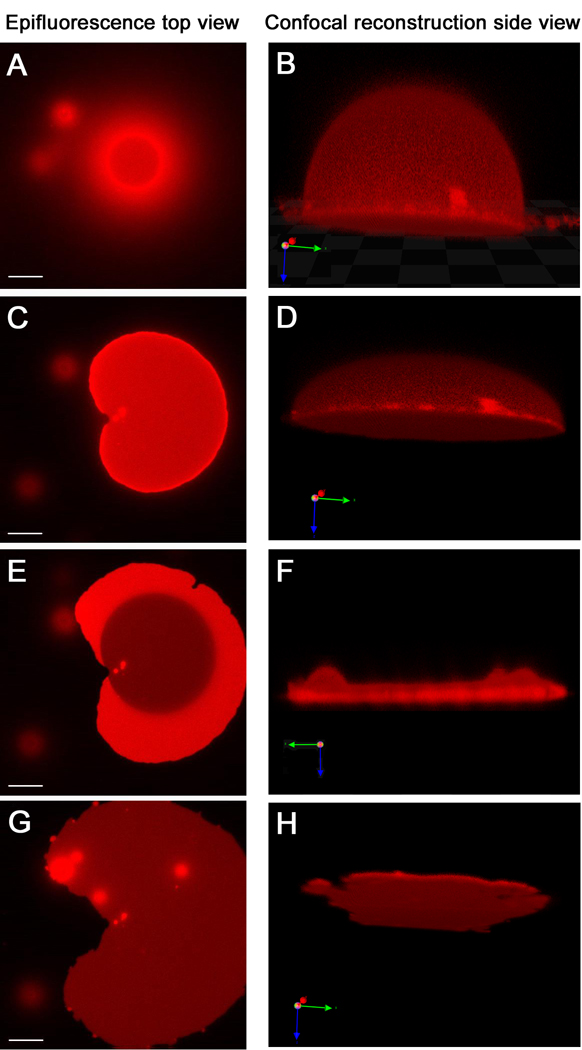
Figure 4.

Giant vesicle to tethered membrane patch transformation observed by fluorescence microscopy. These images are of stable tethered membranes with immobile tethers (Fig 1A); those with mobile tethers are very similar. The epifluorescence microscopy images, left side, and confocal microscopy images in the corresponding state, right side, are displayed in parallel. While F is exhibited parallel to the surface, B, D and H are 20 degree tilted to show a better view of their 3-dimensional shape. (A and B) When the GUV starts to bind via DNA hybridization, only the bottom part of vesicle is in contact with the surface and shows a ring shape. Meanwhile, the upper part of the vesicle out of the focal plane appears as a cloudy halo around the ring. (C and D) Further binding of DNA from the vesicle to the surface flattens the vesicle asymmetrically. (E and F) Eventually, the upper membrane ruptures. Afterwards, a single bilayer remains (dark area) with some transient double bilayer (bright regions). (G and H) After all of the upper bilayer spreads, a homogeneous tethered membrane is formed. While the epifluorescence microscopy images are taken from the same GUV in about 5 minutes, the confocal microscopy images take much longer to collect and are of different GUVs captured at comparable times (see text). Scale bar of epifluorescence microscopy is 15µm.
