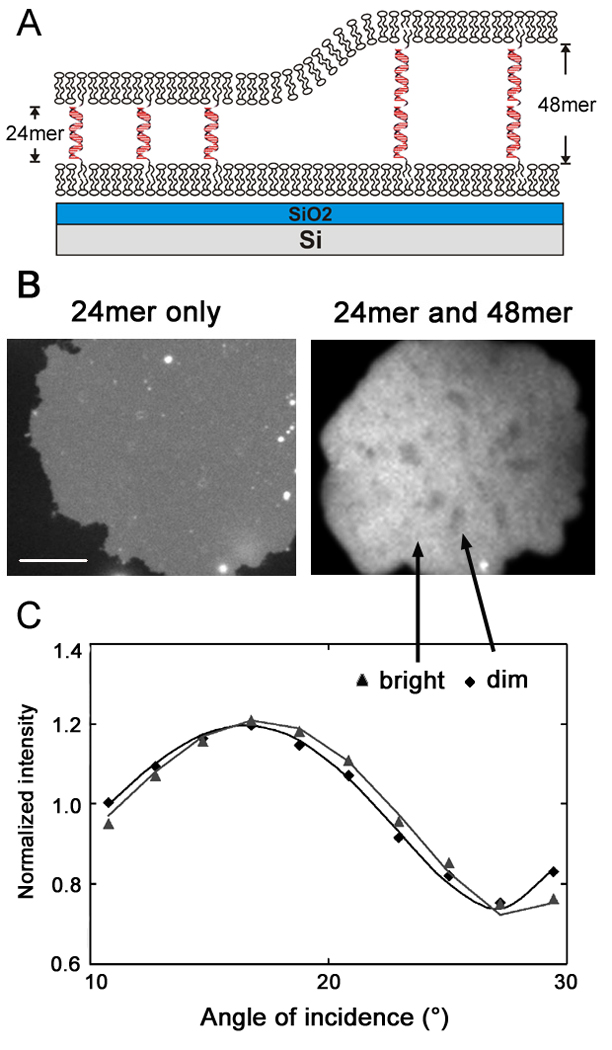
Figure 6.

DNA tether segregation by different lengths of DNA hybridization on a mobile SLB (c.f Fig. 1B). (A) Schematic illustration of segregation involving two lengths of DNA hybrids between the mobile membrane surfaces. The substrate is 260 nm of SiO2 of grown on atomically flat Si to allow for quantitative analysis by VIA-FLIC. (B) Fluorescence image of Texas red labeled tethered bilayer patches. When only 24-mer DNA tethers were used (left, poly A/poly T), the intensity is homogeneous across the membrane. With mixed 24-mer (poly A/poly T) and 48-mer (fully overlapping sequence) tethers, bright and dark domains were observed that indicate regions where the DNA hybrids have segregated by length. Left scale bar is 15 µm, and right image is 10 µm wide. (C) The fluorescence signal as a function of angle of incidence for selected bright and dark regions of the 24/48-mer tethered patch. The intensity counts are normalized by dividing by the mean counts recorded per image for each region, so that the shape of each curve can be more easily compared. The lines show the fits of the VIA-FLIC model to the data: for the dim region, the separation distance is fit as 10.0 nm, for the bright region, it is fit as 16.9 nm.
