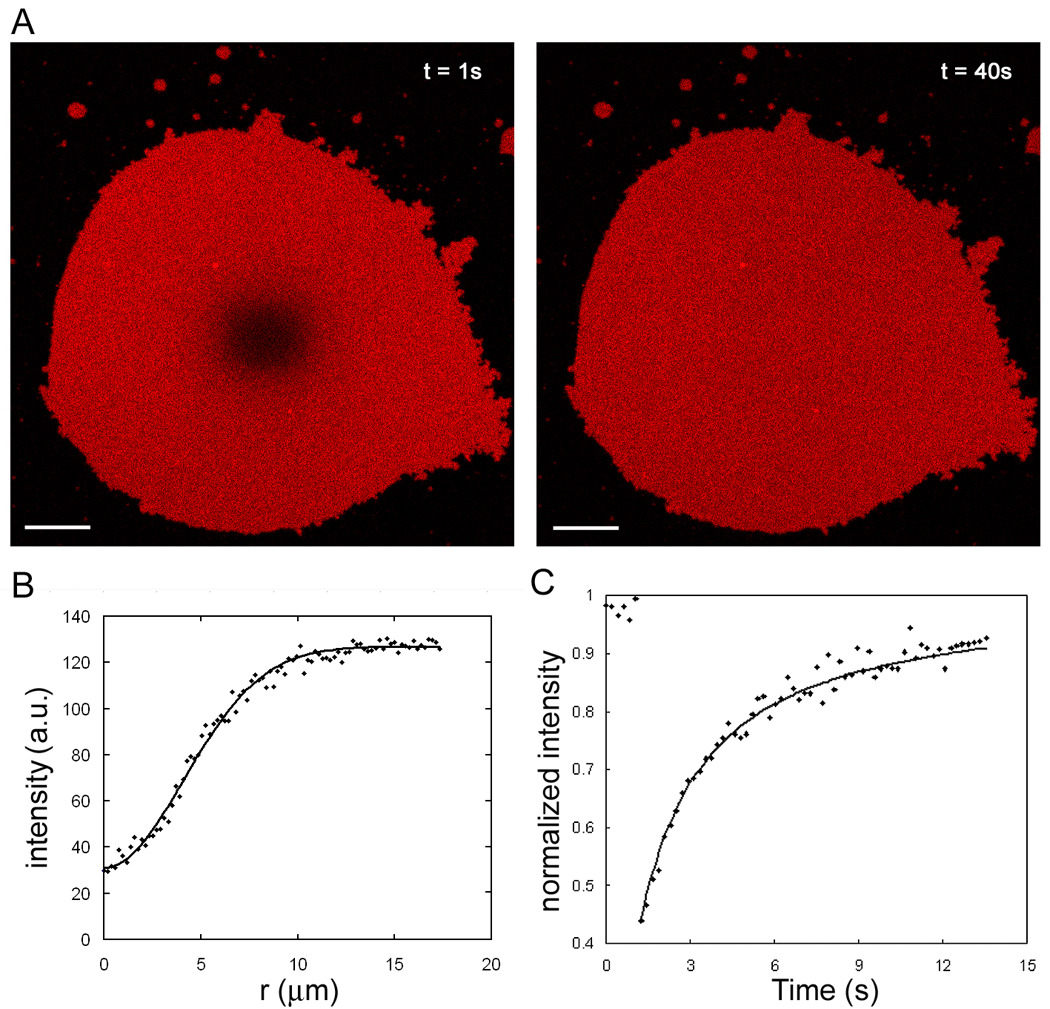
Figure 7.

FRAP analysis of lipid mobility in tethered membrane patches. (A) The images show a representative example of recovery after photobleaching of 4 µm bleached spot (left) in a fluorescently labeled DNA-tethered membrane patch. This is on the immobilized DNA tethers as Figure 1A. Scale bar is 5 µm. (B) Circular averaged radial profile (dots) from the center of bleached spot is generated from the initial intensity profile after bleaching, I(r, t = 0), to reduce noise. K and w values (see Materials and Methods) from a fit to a Gaussian function (line) are used for plotting graph C. (C) Representative normalized fluorescence intensity recovery curve (dots) of bleached spot is plotted. This is fitted to obtain diffusion coefficient and mobile fraction (line). The first 6 data points are intensities before bleaching.
