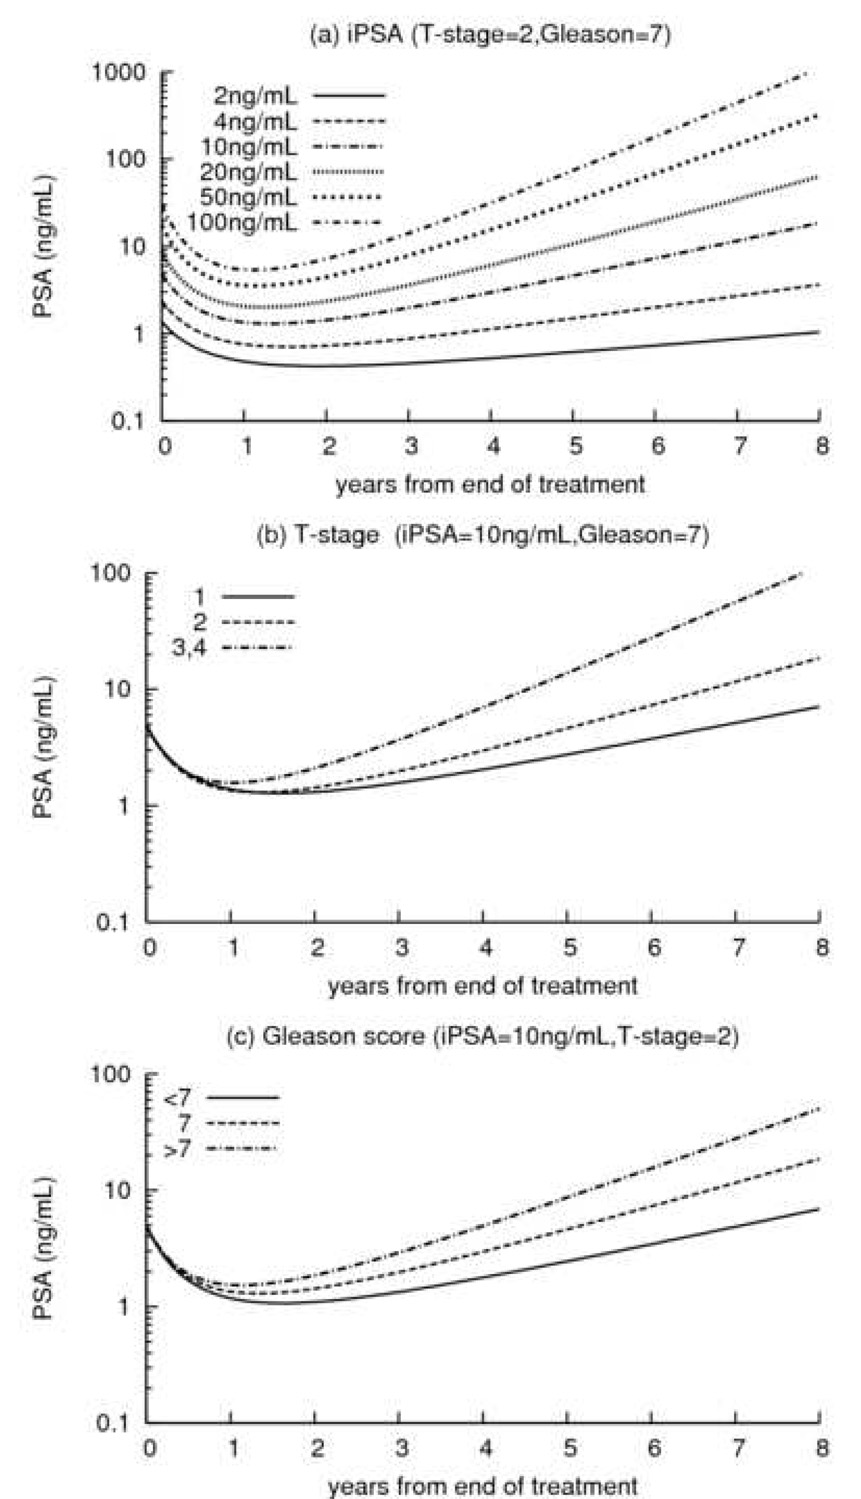
Figure 2.
Predicted evolution of PSA after EBRT according to: (a) initial PSA for a subject with a Tstage= 2 and Gleason=7 (PSA range from 0.1 to 1000ng/mL); (b) T-stage for a subject with an initial PSA=10ng/mL and Gleason=7; (c) Gleason score for a subject with an initial PSA=10ng/mL and Tstage= 2.

