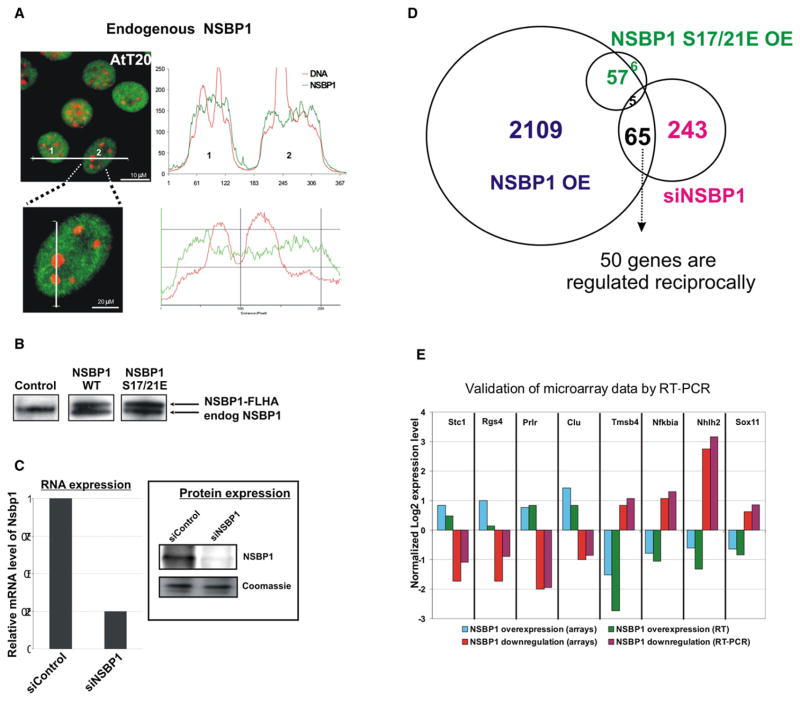
Figure 3. NSBP1 Modulates the Transcription Profile of AtT20 Cells.
(A) Fluorescent images of mouse pituitary AtT20 cells demonstrate that NSBP1 is depleted from constitutive heterochromatin. Localization profiles are shown for two cells, labeled 1 and 2, and a magnification of cell 2.
(B) Western blot analysis of AtT20 cells stably transfected with vectors expressing FLAG-HA (FLHA)-tagged wild-type (WT) NSBP1 or NSBP1S17/21E. Note that the levels of the exogenous protein are similar to the endogenous NSBP1 (endog NSBP1).
(C) Downregulation of NSBP1 expression by siRNA. Shown are RT-PCR and western blot analysis of AtT20 cells treated with siRNA against NSBP1 or control siRNA.
(D) Venn diagram depicting the overlap of genes whose expression is altered by either overexpressing wild-type NSBP1 (NSBP1 OE) or the NSBP1S17/21E mutant (NSBP1S17/21E OE) or by siRNA-mediated downregulation of NSBP1 (siNSBP1).
(E) Validation of microarray data. Shown is normalized log 2 expression of eight selected genes whose expression was reciprocally up- and downregulated by the overexpression or deletion of NSBP1 in AtT20 cells.

