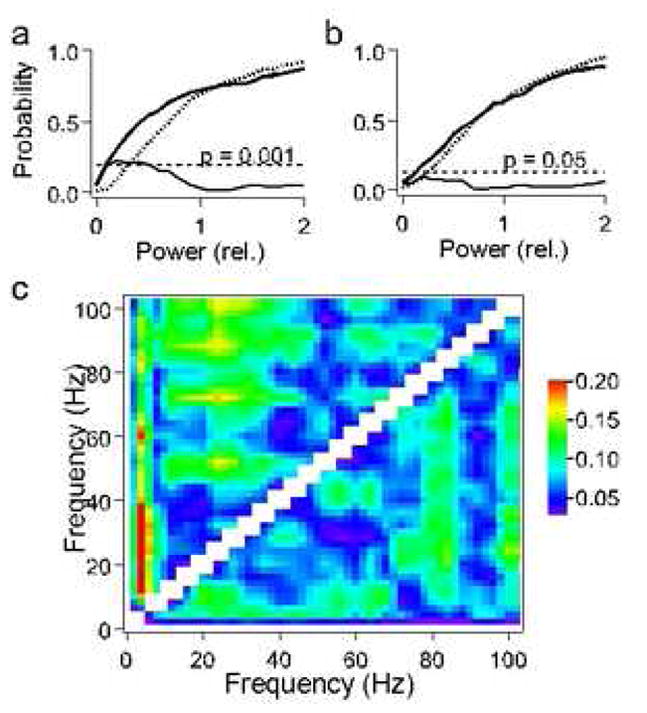
Fig. 2.

Empirical power distributions of the LFP spectra over 200 repetitions of the same call. The descending Rippled FM (dRFM) call shown in figure 1a is always emitted as a pair of syllables. The difference (thin line) between the empirical probability functions describing power distributions at frequencies 3 Hz (bold line) and 40 Hz (dotted line) is significant for the LFP (p<0.001)(a) and insignificant for the control data (p>0.05)(b) obtained by band-pass filtering 1–100 Hz of the Gaussian white noise (Smirnov’s criterion). (c) Color matrix for maximal differences between the power distributions of the LFP spectrum for all pair-wise comparisons between frequencies 1, 2,…, 100 Hz for call 7 (upper left part of the matrix) and call 1 (lower right part of the matrix). These differences are significant (red color, p<0.001; green color, p<0.05) for high frequencies (>20 Hz) versus low frequencies (<20 Hz). Note that there are also significant differences between power distributions within the range of beta-gamma-band frequencies. This may indicate that there are several sources and/or types of gamma-band oscillations at different frequencies, which are relatively independent of each other. For example, for call 7, gamma-band rhythms at 53 Hz, 72 Hz and 87 Hz may be independent from rhythms at 25 Hz, as indicated by regions of yellow and green colors.
