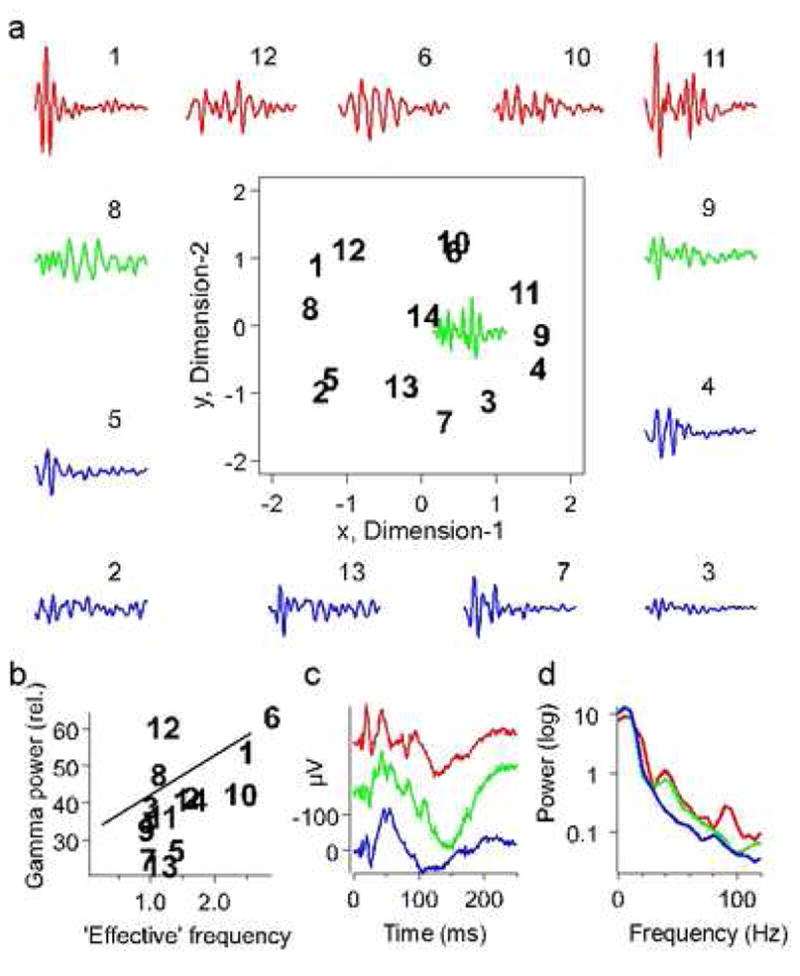
Fig. 3.

Effect of harmonic structure of calls on the evoked gamma-band response. (a) Gamma-band responses are placed along the perimeter of the two-dimensional scaling plot segregating calls according to their ‘harmonic complexity’ quantified by the ‘effective’ frequency of a call (Medvedev and Kanwal, 2004). Gamma-band responses to calls with a high number of harmonics (i.e., the ‘effective’ frequency is high) are shown in red, gamma-band responses to calls with a low number of harmonics but broadband spectra due to a strong FM (intermediate values of the ‘effective’ frequency) are shown in green and gamma-band responses to calls with a low number of harmonics and weak FM (the ‘effective’ frequency is low) are shown in blue. (b) The amount of gamma-band activity in the LFP power spectra normalized to their average power over 1–100 Hz (‘relative’ spectra) significantly correlated with the ‘effective’ frequency of a call (regression line slope >0 at p=0.02). (c) Group-averaged LFPs. (d) Power spectra of the group-averaged LFPs. Note the prominent spectral peaks at gamma-band frequencies in the LFP spectra for groups 1 (red) and 2 (green).
