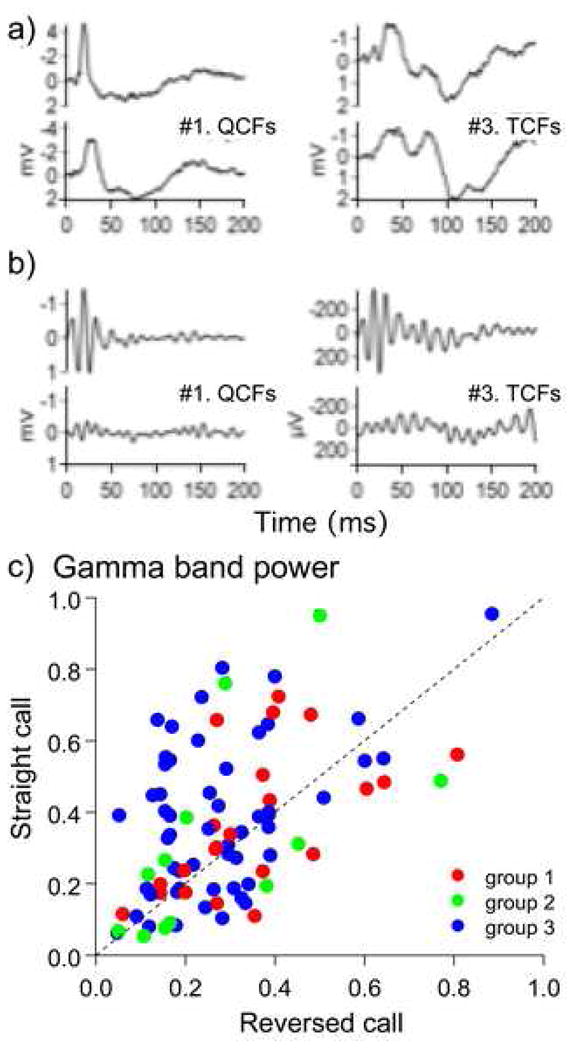
Fig 4.

LFPs (a) and evoked gamma-band activity within 20–100 Hz filtered from the LFP (b) during presentation of two natural calls (top traces) and the same calls reversed in time (bottom traces). Note that call reversal does not affect the waveform and the temporal profile of the slow components of the LFP (a) while the gamma-band response to reversed calls is attenuated (b). Scatter plot in (c) shows the effect of call reversal on gamma-band activity for each call type and for every recording site. For each call presented in the forward and the reverse direction, the corresponding LFP spectra are calculated and normalized to their average power to compensate gross amplitude changes. Gamma-band power is calculated by integrating the LFP spectra over the range 20–100 Hz. Power values for the straight calls 1–14 are plotted against the corresponding values for the reversed calls. Note that the distribution of points within the scatter plot is not symmetrical and has a wider scattering, especially for group 3 (blue dots) above the bisector line; if call reversal did not change the spectral content of a LFP, the scatter plot would be symmetrical around the bisector line. Filled circles are colored according to their placement in the three groups along the y-axis of the MDS plot as shown in figure 3.
