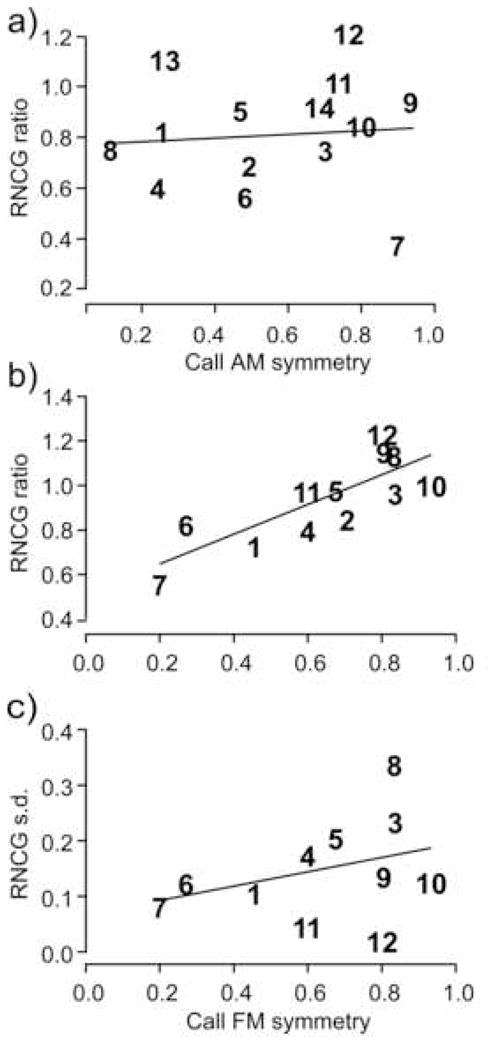
Fig. 5.

Gamma-band response to reversed calls: effect of (a) AM symmetry, and (b) FM symmetry of each call type. Reversed-to-Natural-Call Gamma-band (RNCG) ratio in (a) and (b) is calculated as a ratio of the averaged gamma-band response to the reversed call divided by the averaged gamma-band response to the natural call. This ratio versus the AM (a) and FM (b) symmetry indexes of all call types are plotted. For the AM symmetry, regression line slope = 0.16 ± 0.53 (mean ± s.d.) and is insignificantly different from 0 (p = 0.76, n = 14). Contrary to that, the RNCG ratio significantly correlates with the FM symmetry index (regression line slope = 0.67 ± 0.16 and significantly >0 at p = 0.0017, n = 12). c) Standard deviation (s.d.) of gamma-band power within LFP to a reversed call is plotted against the corresponding FM symmetry index for each call type. Note a greater variability of gamma-band response for reversed calls with high FM symmetry within 0.6–1 range. The regression line (slope = 0.13 ± 0.12, mean ± s.d.) is insignificantly different from zero (p = 0.3; Pearson’s correlation coefficient, r = 0.34; n = 12). Calls are assigned numbers from 1 to 14 based on their acoustic classification (Kanwal et al., 1994). FM symmetry was not calculated for call types 13 and 14 that are patterns of noise bursts.
