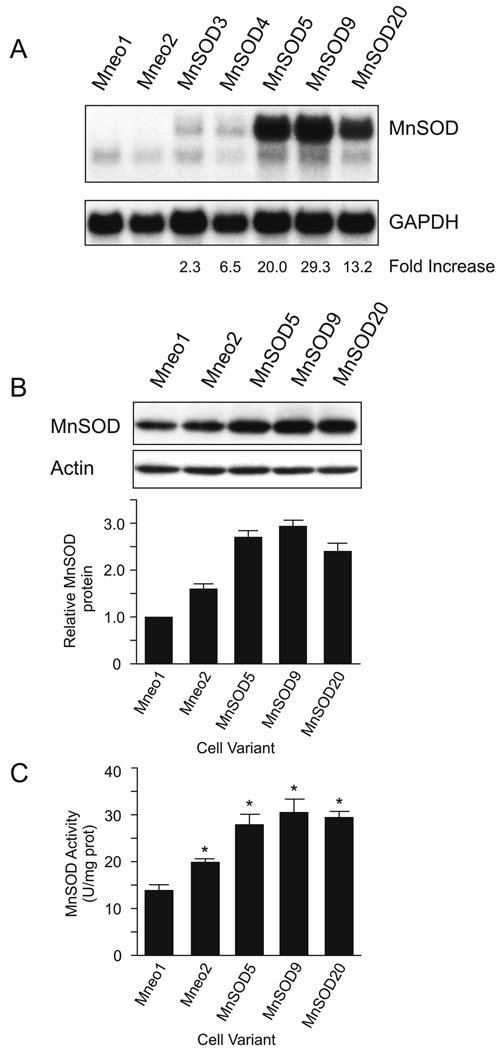
Figure 1.
Comparison of the MnSOD expression in the MnSOD-transfected and vector-transfected WEHI7.2 cells. A. Northern blot demonstrating MnSOD mRNA and the fold mRNA increase after correction for GAPDH expression. B. Representative immunoblots showing MnSOD and actin protein in selected clones. The lower panel indicates the average amount of MnSOD protein relative to that in Mneo1 quantitated from three independent blots. Representative full-length blots are presented in Supplementary Figure 1. C. MnSOD activity in the selected clones. Values represent the mean + S.E.M. (n=3). * denotes significantly different from Mneo1 values (p ≤ 0.05).

