Figure 3.
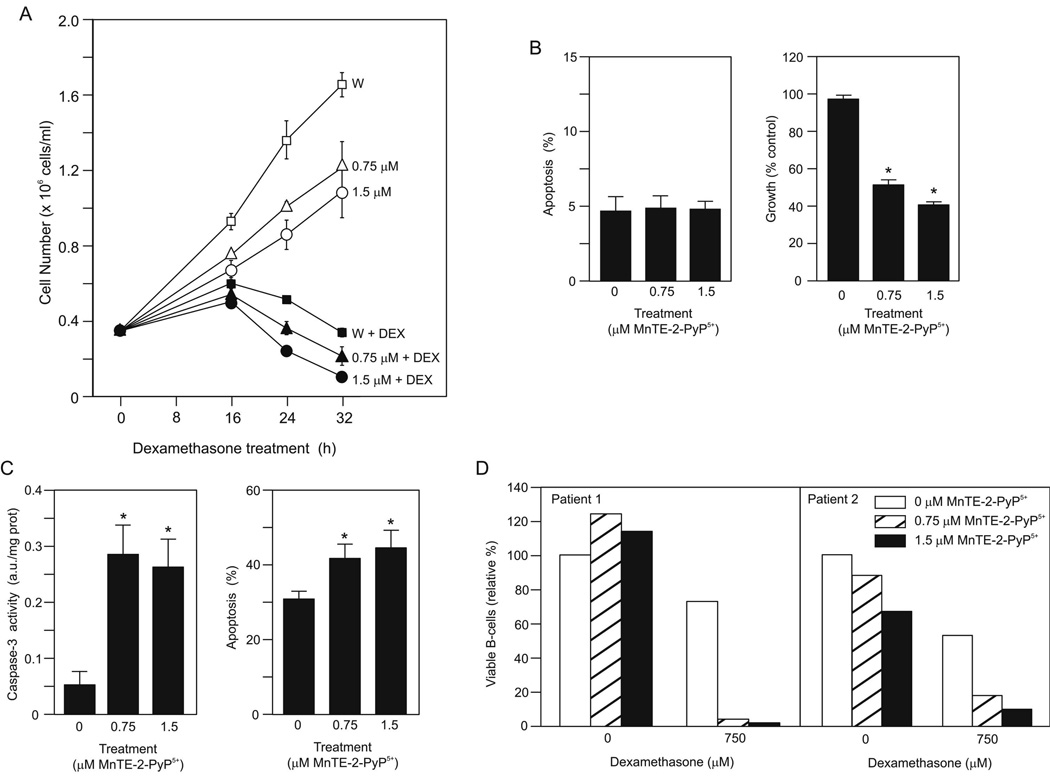
MnTE-2-PyP5+ sensitized WEHI7.2 cells and primary follicular lymphoma cells to dexamethasone-induced apoptosis. A. Number of viable cells in the culture after a 2 h pretreatment with MnTE-2-PyP5+ and the addition of dexamethasone (DEX) or vehicle at time 0. W symbolizes WEHI7.2 cells without MnTE-2-PyP5+. This is a representative experiment, which has been replicated. B. (left panel) Percentage of apoptotic cells (annexin V positive and propidium iodide negative) in culture after a 24 h treatment with the indicated concentrations of MnTE-2-PyP5+. Values are mean + S.E.M (n = 6). (right panel) Cell growth in MnTE-2-PyP5+-treated cultures compared to control cells. Values represent the mean + S.E.M. (n = 36). * denotes significantly different from control (no MnTE-2-PyP5+ cells) (p ≤ 0.05). C. (left panel) Caspase-3 activity in cells after MnTE-2-PyP5+ pretreatment followed by an 8 h dexamethasone treatment. The values have been corrected for the caspase activity in vehicle-treated cell cultures. Values represent the mean + S.E.M (n = 4). (right panel) Percentage of apoptotic cells in culture after MnTE-2-PyP5+ pretreatment followed by a 28 h dexamethasone treatment. The values have been corrected for the % apoptosis in vehicle-treated cell cultures. Values represent the mean + S.E.M (n = 6). D. Relative % live B-cells remaining in culture 24 h after drug treatment. CD20 positive/propidium iodide negative cells were considered live B-cells. The value for the sample with no drugs for each patient was set to 100%.

