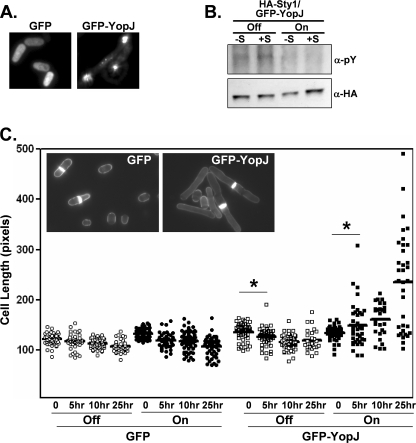
FIGURE 3.
YopJ expression in S. pombe. A, fluorescence of live wild-type cells transformed with either GFP- or GFP-YopJ-encoding plasmids (strains 670W and 672W, respectively). B, the S. pombe (Sty1-HA) strain transformed with the GFP-YopJ-encoding plasmid (639W) was either left uninduced (Off) or induced (On) for GFP-YopJ expression for 12 h and then either left unexposed (-S) or exposed (+S) to osmotic stress (1 m KCl) for 20 min. Cells were then collected and lysed, and Sty1-HA was immunopurified. Immunoprecipitates were analyzed by Western analysis using the indicated antisera. pY, anti-phosphotyrosine. C, transformed strains (circles, 670W; boxes, 672W) were either left uninduced (Off, open symbols) or induced (On, closed symbols) for GFP or GFP-YopJ expression for 12 h and then exposed to osmotic stress (1 m KCl) for 0–25 h. At the indicated time points, cells were removed, stained with calcofluor, and examined by microscopy. Cells staining positive for a septum (as shown in the inset), indicative of the G2/M phase of the cell cycle when cells are at their maximal length, were measured using a molecular ruler (9.8 pixels/micron). Solid bars, population medium. *, p < 0.05.

