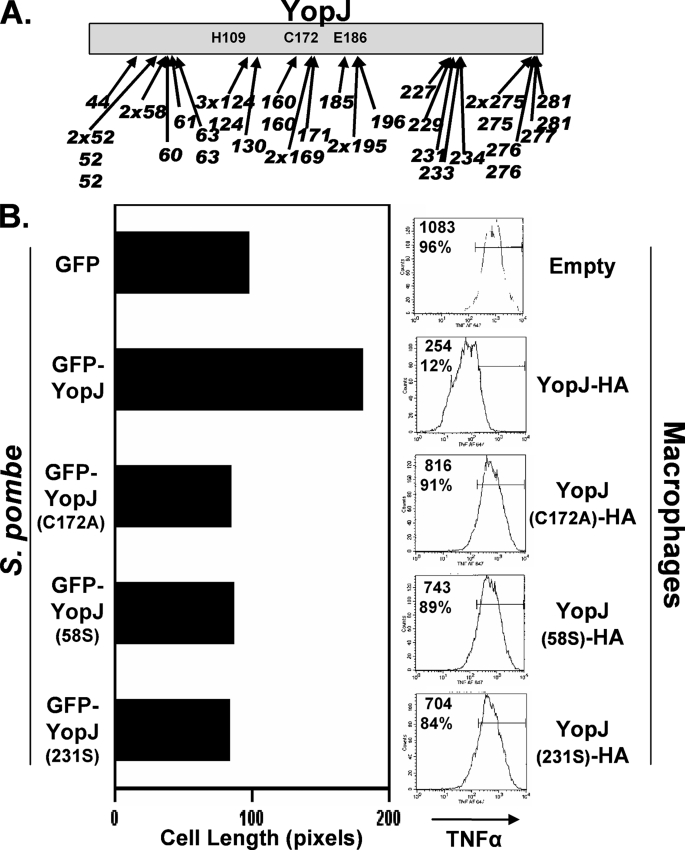
FIGURE 4.
YopJ activity in S. pombe and infected macrophages. A, S. pombe transformed with a randomly generated library of GFP-YopJ variants containing 5-codon nonpolar inserts (scars) were plated on media that differentiated between transformants expressing active and inactive YopJ (elongated and short cells, respectively; see “Experimental Procedures” for details). Plasmids from transformants displaying the short cell phenotype were recovered, and the scar locations of 40 such YopJ variants are shown. (Indicated are the YopJ residues that are immediately followed by the scar sequence.) Both nonidentical and identical clones were recovered for three locations (residues 52, 124, and 275), whereas other locations were represented either singly (e.g. 44), by identical clones (e.g. 58 and 169), or by nonidentical clones (e.g. 63, 276). B, left panel, liquid-grown S. pombe transformed with plasmids encoding either GFP (670W), GFP-YopJ (672W), GFP-YopJ(C172A) (674W), or two variants recovered in the plate-based screen, GFP-YopJ(58S) and GFP-YopJ(231S) (677W and 685W, respectively), were evaluated following osmotic stress (1 m KCl for 20 h) in the cell elongation assay described in Fig. 3C. Right panel, sequences encoding the indicated YopJ variant were cloned into a Yersinia expression plasmid and transformed into the Y. pseudotuberculosis ΔyopJ strain (3). The transformed strains were added to cultured RAW 267 mouse macrophages, and 2 h later, cells were collected and intracellularly stained for tumor necrosis factor α and analyzed by flow cytometry. Shown within each histogram are the mean fluorescence intensity as well as the percentage of cells falling within the indicated gate.

