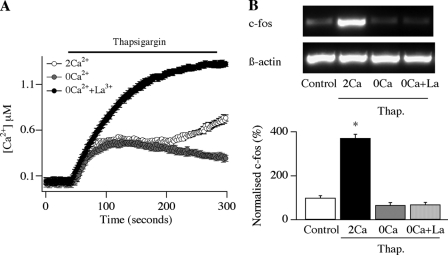
FIGURE 1.
Local Ca2+ entry activates c-fos expression. A, Ca2+ signals evoked by thapsigargin (2 μm) are shown for the various conditions. B, gene expression evoked by thapsigargin (Thap.) is compared in 2 Ca2+, 0 Ca2+, and 0 Ca2+ plus La3+. Top panel, typical gel; bottom panel, aggregate data from four experiments. The only stimulation protocol that differed from the control (non-stimulated) state was thapsigargin in 2 mm Ca2+ (p < 0.01, ANOVA). c-fos expression has been normalized to the control level.

