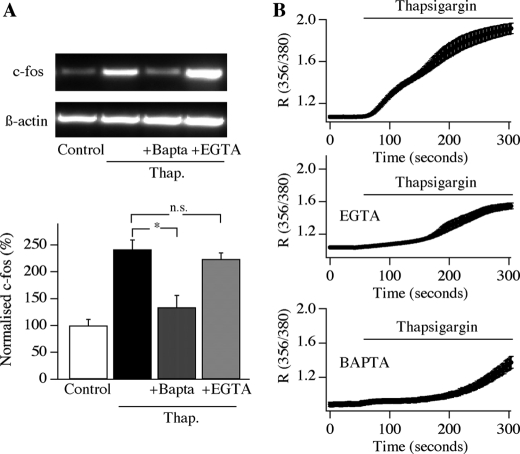
FIGURE 3.
Thapsigargin-evoked c-fos expression is blocked by cytoplasmic BAPTA but not EGTA. A, a typical gel is shown in the top panel, and aggregate data from four independent experiments is shown below. There was no significant difference between thapsigargin (Thap.) and thapsigargin/EGTA groups, but p was <0.01 between thapsigargin and thapsigargin/BAPTA (ANOVA). B, thapsigargin-evoked Ca2+ signals are compared between control cells, cells loaded with BAPTA, and cells loaded with EGTA (number of cells between 20 and 33). Error bars (S.E.) are included in each graph.

